An IQ of 130 on one test could be exactly identical to an IQ of 148 on another. Understanding standard deviation is the absolute foundation of accurate cognitive interpretation.
1 Quick Answer
Updated April 24, 2026 by Structural. On modern adult intelligence scales such as WAIS and ACIS, the standard deviation is typically 15 points (SD 15). That number defines how far scores spread from the mean of 100 and how ACIS bands scores from Average through High Average, Superior, and the gifted classifications.
The key point is simple: raw IQ numbers are not universal units. A score only becomes comparable when you know the scale behind it. For example, 130 on an SD 15 test represents roughly the same rarity as 148 on an SD 24 scale, even though the printed numbers look very different.
SD = 15WAIS / ACIS
A common modern reference scale for adult intelligence batteries.
SD = 16Stanford-Binet
A closely related scale that spreads scores slightly wider.
SD = 24Cattell
A wider-number scale where equivalent rarity appears as a higher raw score.
Mean Score100
The center of the scale, regardless of whether the SD is 15, 16, or 24.
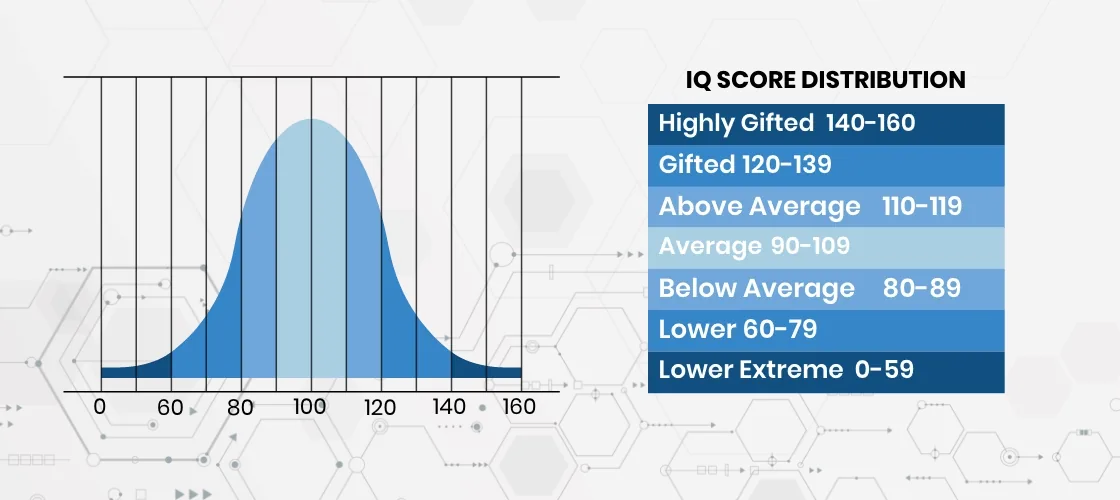
IQ scores are usually interpreted against a bell curve. Standard deviation provides the spacing for that curve, telling you how quickly rarity increases as you move away from the mean of 100.
On an SD 15 scale, about 68.2% of people fall between 85 and 115, and about 95.4% fall between 70 and 130. That is why 130 is commonly treated as an important threshold: it is roughly two standard deviations above the mean and lands near the top 2.3%.
Once you understand the deviation width, the rest becomes easier: percentiles tell the real story, while raw numbers are just labels attached to a specific scoring scale.
3 The Direct Conversion Table
When you compare scores across different instruments, convert them back to percentile rarity or z-score. That is the cleanest way to see whether two different numbers really mean the same level of performance.
Percentile
WAIS / ACIS (SD 15)
Stanford-Binet (SD 16)
Cattell (SD 24)
84.1st (+1 Deviation)
115
116
124
97.7th (+2 Deviations)
130
132
148
99.9th (+3 Deviations)
145
148
172
99.99th (+4 Deviations)
160
164
196
The scale illusion: raw numbers can look dramatically different even when rarity is the same. A wider SD produces larger-looking IQ values without necessarily implying rarer performance.
Quick rule: first compare percentiles, then compare the test, and only then compare the printed IQ numbers.
Mensa requires applicants to perform in the top 2% of the general population to secure membership. Because of the differing standard deviations, Mensa maintains multiple score cutoffs depending entirely on which test was administered.
130 on WAIS/ACIS
On an SD 15 scale, 130 lands at roughly the 97.7th percentile, which satisfies the usual top 2% cutoff.
148 on Cattell
On an SD 24 scale, a higher raw number is needed to represent the same percentile position.
If you score 140, the scale matters. On SD 15, that clears the threshold comfortably. On SD 24, it corresponds to a lower percentile and does not represent the same rarity. The admission decision follows percentile equivalence, not the size of the raw number.
5 Frequently Asked Questions
What is the standard deviation of the WAIS test? The Wechsler Adult Intelligence Scale utilizes a standard deviation of exactly 15 points.
Why don't all tests use the same deviation scale? Because different test families were developed with different scoring conventions. To compare them properly, use percentile rank or z-score rather than the raw IQ number alone.
Is an SD 24 test less accurate than an SD 15 test? Not automatically. Accuracy depends on the instrument's design, calibration, reliability, and norms, not just on whether the scale is narrower or wider.
6 Related Guides
Expand your understanding of advanced psychometric interpretations: