Is IQ real? A statistical regularity, a valid measurement, and an open causal question
The question of whether IQ is real is really three questions. Whether the correlations an IQ test summarizes exist is settled: every cognitive task correlates positively with every other, in every sizeable sample examined since 1904, in 31 non-Western nations as much as in Edinburgh. Whether the number is a valid measurement is settled by reliability, stability and prediction. Whether one causal thing called g produces the pattern is not settled, and this page keeps the three apart.
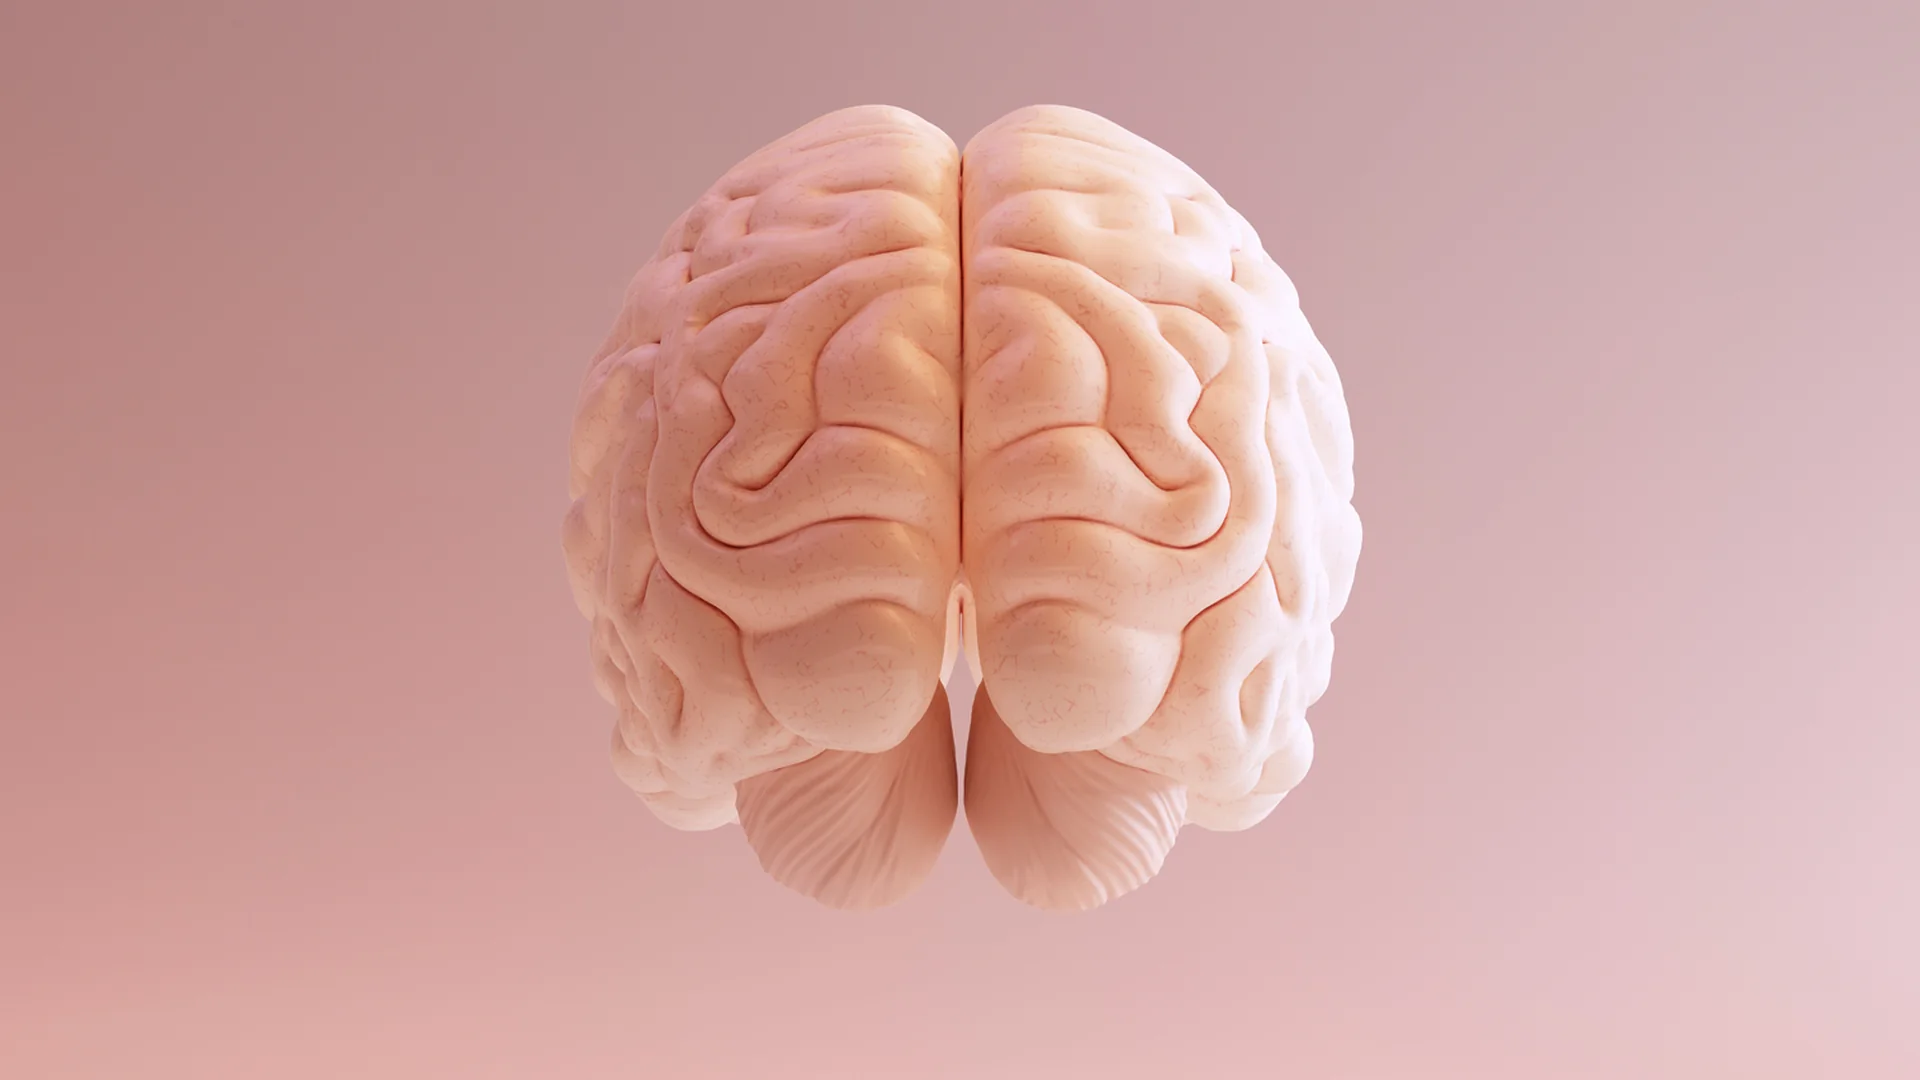
The organ is where the correlations come from, but the construct an IQ measures is the regularity itself: every cognitive task correlates positively with every other, in every population examined since 1904.
0 Quick Answer
IQ is real in the sense that matters for a measurement: it quantifies a statistical regularity that has appeared in every sizeable set of cognitive tasks examined since 1904, it does so with a reliability and a lifetime stability that few measurements in psychology match, and it predicts education, work, health and death decades in advance; whether the regularity is produced by a single causal entity called g is a separate question that remains open. The regularity is the positive manifold, the finding that scores on every kind of cognitive task correlate positively with scores on every other, documented by Charles Spearman in 1904 and reproduced since in every population studied, including 97 samples from 31 non-Western nations totaling 52,340 people, in which the first factor explained an average of 45.9 percent of the variance in the scores. The general factor, g, is the statistical summary of that manifold, and an IQ is the best single estimate of a person's standing on it. When the same people take several batteries built by different authors, the g factors extracted from each correlate at .99 to 1.00, the strongest evidence that the thing measured does not depend on who wrote the test.
The measurement holds up on the criteria a construct has to meet. In ACIS the Full Scale composite reliability is .9886 and the standard error of measurement is 1.60 points, according to the technical manual. Scores on the same test taken at 11 and again at 77 correlated at .63 in the Scottish follow-up, and childhood scores predict educational attainment, occupational level and mortality from most major causes across 68 years of follow-up in a whole national birth cohort. An artifact of test construction would not survive a change of battery, persist across a lifetime, or predict death.
What is not settled is the causal question. The positive manifold can be produced by a single general capacity, and it can also be produced by many processes that reinforce one another during development, as the mutualism model of van der Maas and colleagues showed in 2006. The critiques that deserve a hearing, including Stephen Jay Gould's charge that g is a reified statistic, bear on this causal question and not on the measurement, and the page on the g factor explains the distinction. The sibling page on what IQ is defines the number; this page asks whether the number refers to anything, and answers that it refers to a real regularity, measured well, whose cause is still being worked out.
45.9 percent
The average share of test score variance explained by the first factor across 97 samples from 31 non-Western nations and 52,340 people, close to the figure in Western samples.
.95 to 1.00
The correlations among the g factors extracted from five different test batteries taken by the same roughly 500 Dutch seamen; three batteries in 436 Minnesotans gave .99 to 1.00.
.63
The correlation between scores on the same Moray House test taken at 11 in 1932 and again at 77, in 101 people; about .73 after correction for range restriction.
0.72 to 0.84
The hazard ratios per standard deviation of childhood IQ for death from respiratory disease, heart disease, stroke, injury, smoking related cancers, digestive disease and dementia in 65,765 Scots followed for 68 years.
A measurement is real when it tracks a regularity that exists independently of the instrument, and the argument about IQ goes wrong whenever that question is confused with two others: whether the number is precise, and whether a single cause produces it. Temperature is the standard example: before anyone knew what heat was, thermometers agreed with one another, repeated their readings and predicted whether water would boil, so the construct was real as a measurement long before its cause was understood. The question for IQ has the same form: do the scores refer to a regularity that is there whether or not anyone tests for it, and does the number behave the way a measurement of a real quantity behaves?
Psychometrics answers with construct validity, the accumulated evidence that a score means what it claims to mean, and this page takes its parts in order. Internal structure: do the tasks a test contains hang together in the way the construct requires? Convergence: do different instruments built for the same construct agree? Reliability: does the number repeat? Stability: does a person's standing persist over time? Prediction: does the score forecast things outside the test, measured later and independently? Correlates: does the score relate to biological measures that no test author chose? The page on reliability and validity sets out how ACIS documents each, and the page on what a cognitive test is explains how the tasks are built in the first place.
The third question, whether one causal entity produces the pattern, is different in kind. Borsboom, Mellenbergh and van Heerden argued in Psychological Review in 2003 that to claim a test measures an attribute is already to claim that the attribute exists and produces variation in the scores, so the realism question cannot be dismissed by calling g a mere statistic; they also showed that a latent variable extracted from differences between people does not automatically describe a process inside any one person. That is the correct frame. The manifold is a fact about populations. Whether it is generated by one capacity, by many mutually reinforcing processes, or by tests sampling overlapping sets of elementary abilities is a question about mechanism, and the evidence for the measurement does not settle it.
Keeping the three apart disposes of two lazy answers: that IQ is just a number on a test, which is false because the number behaves like a measurement of something outside the test, and that IQ is intelligence, which is more than the evidence supports because intelligence in ordinary usage includes judgment, creativity and knowledge that the tests sample only partly. The defensible position is narrower than either.
2 The Positive Manifold: The Fact That Started Everything
The fact on which everything rests is that performance on any cognitive task correlates positively with performance on any other, and in more than a century of testing no sizeable sample has produced the opposite. Spearman noticed it in 1904 in the marks of village schoolchildren and in their performance on simple sensory discriminations, and proposed in the American Journal of Psychology that a single common factor, which he called g, ran through all of them alongside a factor specific to each task. The correlations are not an artifact of similar tasks. Vocabulary correlates with the speed of matching symbols under a clock; holding digits in mind correlates with completing a visual pattern; arithmetic correlates with remembering a story. Tasks that share no content, no format and no response mode still correlate, and that is the phenomenon a factor analysis then summarizes.
The claim that this is a Western artifact was tested directly by Warne and Burningham in Psychological Bulletin in 2019. They gathered 97 data sets from 31 non-Western, nonindustrialized nations, 52,340 people in all, and ran exploratory factor analyses with modern methods for choosing the number of factors. A single factor emerged unambiguously from 71 of the 97 samples, and 23 of the remaining 26 produced a single second order factor once the first order factors were allowed to correlate. The first factor explained an average of 45.9 percent of the variance in the observed scores, with a standard deviation across samples of 12.9 percent, which is the range seen in Western data. Whatever g is, it is not a property of European or American test takers.
ACIS shows the same structure in its own reference frame. In the technical analysis set of 2,750 adults, the Verbal Comprehension Index correlates .801 with the Fluid Reasoning Index, .764 with Quantitative Reasoning, .783 with Visual Spatial, .670 with Working Memory and .577 with Processing Speed. The lowest of those, verbal knowledge against speeded visual decisions, is still a large positive correlation between tasks with nothing in common on the surface. The page on the six cognitive domains describes each index, and the page on the CHC model shows how the broad abilities sit under the general factor in the taxonomy most batteries use.
A reader who wants to reject IQ has to explain the manifold, and the explanation cannot be that the tests were designed to produce it. An ability independent of the rest would be worth measuring on its own, so test authors have always had a reason to find one, and John Carroll's survey of more than 460 data sets in Human Cognitive Abilities in 1993 found no such ability, only a hierarchy with a general factor at its top. The manifold is a discovery, not a design choice.
3 One g or Many? Replication Across Test Batteries
If g were an artifact of a particular set of tasks, different batteries would yield different g factors; when the same people take several batteries, the g factors are almost identical. Johnson, Bouchard, Krueger, McGue and Gottesman tested this in Intelligence in 2004 with 436 adults from the Minnesota twin studies who had each completed three batteries built on different theories: the Comprehensive Ability Battery, the Hawaii Battery with Raven's matrices, and the Wechsler Adult Intelligence Scale. They extracted a general factor from each battery separately and then estimated the correlations among the three factors. The correlations were .99 to 1.00. The batteries disagreed about how many broad abilities to include and how to name them; they did not disagree about who stood where on the general factor.
Johnson, te Nijenhuis and Bouchard repeated the test in Intelligence in 2008 with a different population, about 500 Dutch seamen who had completed five batteries, and found g factor correlations of .95 to 1.00. The title of the second paper, "Still just 1 g", is the finding.
This is the point at which the objection that IQ only measures how good you are at IQ tests fails as stated. If the scores measured only skill at a specific test, a differently built test would measure a different skill and the general factors would diverge. They converge to within measurement error. What is shared across batteries is the manifold itself, not any author's choice of items, and the page on Full Scale IQ explains why a composite of many diverse subtests is the most accurate estimate of it.
ACIS is built on that logic. Its confirmatory factor model places a higher order general factor above six domain indices, with a comparative fit index of .9761, and the general factor loads on the indices at .864 for verbal comprehension, .922 for fluid reasoning, .882 for quantitative reasoning, .906 for visual spatial ability, .788 for working memory and .648 for processing speed. The Full Scale score loads on the general factor at .958, and its omega hierarchical, the share of its variance attributable to the general factor alone, is .917. An ACIS Full Scale score is therefore an estimate of the same factor that the Minnesota and Dutch studies found to be battery independent, and the page on how IQ is calculated shows the arithmetic by which twenty subtests become that estimate.
4 Reliability: Does the Number Repeat?
A real measurement repeats itself, and the reliability of a Full Scale score is among the highest of any measurement in the behavioral sciences. Reliability is the proportion of the variance in observed scores that is not measurement error, on a scale from 0 to 1; a reliability of .90 means that ten percent of the spread in scores is noise. From reliability follows the standard error of measurement, the typical distance between a person's observed score and the score they would average across many administrations, which equals the standard deviation of the scale multiplied by the square root of one minus the reliability. The page on the standard deviation of 15 explains the scale the formula is applied to.
The ACIS figures illustrate what a modern battery achieves. The Full Scale composite reliability, computed as omega, is .9886, and the standard error is 1.60 points, so a 95 percent confidence interval spans about 3.1 points either side of the reported score, by our arithmetic on the published error. Individual subtests are less precise, as they should be, since each samples a narrower ability with fewer items: Matrix Reasoning has a reliability of .930 and a standard error of 0.79 scaled score points, Digit Span .890 and 0.99, and Vocabulary .950. A composite of twenty such subtests is more reliable than any of them because their errors are independent and their true scores are correlated, which is the positive manifold doing useful work. The manual reports reliability for every ACIS index and subtest, so the precision of each number a report prints is public rather than assumed.
Reliability is necessary and not sufficient. A bathroom scale that always reads the same wrong weight is reliable and invalid, and a test of trivia could be highly reliable without measuring reasoning. What reliability establishes is that the number is not noise, and that differences between people of more than a few points are differences in something; the something is what the remaining sections examine.
The practical consequence for a reader is that a reported IQ is an interval. ACIS prints the confidence interval of every index beside the score, and a difference of four points between two people, or between two occasions, lies inside the combined error and should not be read as a difference at all. Two indices in the same profile that differ by fifteen points differ by far more than their combined error, and the profile is where a report carries most of its information.
5 Stability: The Same Test at 11 and at 77
A person's standing on the general factor persists across most of a lifetime, which a construct that lived only in the testing session could not do. The cleanest demonstration comes from Scotland. On June 1, 1932, almost every child born in 1921 and attending school in Scotland sat the same Moray House test, and the records survived. Deary, Whalley, Lemmon, Crawford and Starr traced 101 of them in Aberdeen and, in Intelligence in 2000, gave them the same test at 77. The correlation between the two scores, 66 years apart, was .63, and about .73 after the authors corrected for the restricted range of the people who could be traced and retested. Two thirds of a century, a world war, careers, illnesses and the ordinary decline of speed in old age left the rank order of a childhood test largely intact.
That stability has a partly genetic basis. Deary and 19 colleagues used genome wide data from 1,940 unrelated people who had taken the Scottish tests at 11 and been retested at 65, 70 or 79, and reported in Nature in 2012 a genetic correlation of .62 between intelligence at 11 and intelligence in old age, with common genetic variants accounting for about a quarter of the variation in change across the lifetime. The genes that influence childhood scores are largely the genes that influence old age scores, which is what a stable underlying trait would produce and what a session specific artifact would not.
Stability is not fixity. Scores move with schooling, at about one to five points per additional year of education in Ritchie and Tucker-Drob's meta-analysis of 142 effect sizes from 42 data sets and more than 600,000 people, and performance on speeded and memory tasks declines in later adulthood while vocabulary holds, as the page on whether IQ changes with age sets out. What is stable is the relative standing of a person against their age peers, not the raw count of items they can complete, and the age based norms that the page on how IQ scores are normed describes exist to separate the two.
For a reader the stability evidence sets a reasonable expectation. A score taken in adulthood, on a normed battery, with a small standard error, describes a standing that is likely to persist, and a second score years later that differs by ten points has a specific explanation to find, in conditions, in practice or in health, rather than a new self. The page on IQ 100 uses the middle of the scale to show how much a few points of movement do and do not mean.
6 Predictive Validity: Education, Work and Income
A score that was not measuring anything real could not predict events that happen years later, outside any test, and childhood scores predict such events at a level no other psychological measure reaches. Strenze pooled the longitudinal studies in which intelligence was measured before the outcome in a meta-analysis in Intelligence in 2007, and reported correlations of .56 with later educational attainment, .45 with later occupational level and .23 with later income, with intelligence predicting at least as well as parents' socioeconomic status and school grades. Those are population associations that leave most of the variance in any one life to other things.
The largest single study is British. Deary, Strand, Smith and Fernandes followed more than 70,000 English pupils from the Cognitive Abilities Test at 11 to their national examinations at 16 and reported in Intelligence in 2007 a latent correlation of .81 between general ability and examination results five years later. The latent correlation is the correlation between the general factors of the two sets of scores, freed of the error in each, and .81 is close to the ceiling of what one measurement can predict of another taken half a decade on. The page on IQ and academic achievement treats the study in detail.
Work is where the numbers have moved. Schmidt and Hunter's 1998 review of 85 years of selection research put the validity of general mental ability for job performance at .51, and that figure was quoted for two decades. Sackett, Zhang, Berry and Lievens reanalyzed the corrections for range restriction in the Journal of Applied Psychology in 2022 and concluded that the earlier estimates had been systematically overcorrected; their revised validity for general mental ability was about .31, with most selection methods reduced by .10 to .20 and structured interviews moving to the top of the ranking. The page on IQ and job performance explains the correction. The honest current figure is moderate, not large, and a page that quotes .51 without the 2022 revision is out of date.
Income is the weakest of the outcomes, at .23, for reasons the page on IQ and income sets out: income depends on occupation choice, hours, region, luck and inheritance, none of which a reasoning test measures. That is the right shape for a real construct. A number that predicted everything equally would be suspicious; a number that predicts examinations strongly, occupational level moderately and income weakly is behaving like a measure of a specific ability whose relevance varies with the outcome.
7 Predictive Validity: Health and Death
The prediction that settles the argument for most readers is death, because no one disputes that death is real, and childhood IQ predicts it across a whole nation over 68 years. Calvin, Batty, Der, Brett, Taylor, Pattie, Čukić and Deary linked the 1947 Scottish Mental Survey, in which almost every child born in 1936 and at school in Scotland sat the same test at 11, to death records through December 2015, and reported the result in the BMJ in 2017. Among 33,536 men and 32,229 women, each standard deviation of higher childhood score, about 15 points, was associated with hazard ratios of 0.72 for death from respiratory disease, 0.75 for coronary heart disease, 0.76 for stroke, 0.81 for injury, 0.82 for smoking related cancers, 0.82 for digestive disease and 0.84 for dementia. Cancers not related to smoking showed almost no association, at 0.96, which is itself informative: the gradient runs through the causes of death that behavior and circumstances shape.
The confounding objection was tested inside the study. In a representative subsample with fuller records, adjusting for three indicators of childhood socioeconomic status attenuated the associations by only 10 to 26 percent, so most of the gradient survived the most obvious alternative explanation. In a replication cohort, adjustment for smoking and adult socioeconomic status attenuated the associations by 16 to 58 percent, which is what one would expect if part of the path from childhood ability to death runs through the education, occupation and health behavior that ability predicts. The page on IQ and longevity reviews the field of cognitive epidemiology that grew from these cohorts, including the mechanisms proposed.
Two readings of the mortality gradient are compatible with the data and neither embarrasses the construct. One is that the same bodily integrity that produces a well functioning brain at 11 produces longer life, so the test is partly reading a biological system. The other is that ability leads to safer occupations, better health behavior and better navigation of medical care, so the test is reading a capacity that shapes decisions. Either way, a score at 11 that forecasts the cause of death at 79 in a population of 65,765 is not a number about test taking. A hazard ratio of 0.75 describes a population, not a person: the population finding is what establishes that the construct is real, and the individual case is where it says the least.
8 Biological Correlates: Reaction Time, Brain Volume and Genes
A statistical factor that existed only in the arithmetic of test scores would have no reason to correlate with the speed of a button press, the volume of a brain or the sequence of a genome, and it correlates with all three. Deary, Der and Ford measured reaction time in about 900 adults aged 56 from a population sample in the West of Scotland and reported in Intelligence in 2001 that simple reaction time correlated about .31 with a psychometric intelligence test and four choice reaction time about .49, in the direction of faster responses for higher scores. Reaction time has no items, no knowledge and no strategy, and the correlation shows that whatever the tests measure has a footprint in elementary processing.
Brain volume gives a smaller but robust correlation. Pietschnig, Penke, Wicherts, Zeiler and Voracek meta-analyzed 88 studies with 148 samples and more than 8,000 people in Neuroscience and Biobehavioral Reviews in 2015 and found a correlation of .24 between in vivo brain volume and IQ, generalizing across children and adults, across verbal and performance scores, and across sex. They also showed that publication bias had inflated the literature and that brain size should not be read as a proxy for intelligence. The honest figure is a correlation explaining about six percent of the variance: small, real and no basis for anything beyond the statement that the construct touches anatomy. Deary, Penke and Johnson's review in Nature Reviews Neuroscience in 2010 located the more specific correlates in parieto-frontal pathways and in measures of brain efficiency.
The genetic evidence is the largest in scale. Plomin and Deary's five special findings in Molecular Psychiatry in 2015 summarize the twin literature: the heritability of intelligence rises from about 20 percent in infancy to perhaps 80 percent in later adulthood; different cognitive abilities correlate about .30 phenotypically and about .60 or higher genetically, which means the same genes act across tasks in the way a general factor implies; and intelligence is genetically correlated with education, social class and health. Savage and colleagues' genome wide association study of 269,867 people in Nature Genetics in 2018 identified 205 genomic loci and 1,016 genes, each of tiny effect, expressed above all in the brain and enriched in pathways of nervous system development and synaptic structure. The page on what heritability actually means explains why none of this fixes an individual's score or explains differences between groups.
What the biological correlates establish is bounded. They show that the regularity the tests measure is anchored in the organism and not in the testing room; they do not show that g is a single thing in the brain, since a set of mutually reinforcing processes would be heritable and would correlate with reaction time too.
9 The Flynn Effect and Measurement Invariance
Raw performance on IQ tests rose across the twentieth century faster than any genetic change could explain, and the rise is the strongest evidence that an IQ is a norm bound score rather than a constant of nature, which is a limit on the number and not on the construct. Flynn documented gains in 14 nations in Psychological Bulletin in 1987, and Trahan, Stuebing, Fletcher and Hiscock quantified them in a meta-analysis of 285 studies and 14,031 people in 2014: 2.31 standard score points per decade overall, with a 95 percent confidence interval of 1.99 to 2.64, and 2.93 points per decade across 53 comparisons involving modern Wechsler and Stanford-Binet tests, with no sign that the gains were diminishing. The page on the Flynn effect covers the candidate causes.
The gains are not uniform across the abilities a test samples, and that is where measurement invariance enters. A test is measurement invariant across two groups when the same score means the same standing on the underlying ability in both; if it is not, some of the difference in scores reflects a change in what the items measure rather than a change in the ability. Wicherts, Dolan, Hessen, Oosterveld, van Baal, Boomsma and Span tested invariance across cohorts in Intelligence in 2004 and found that the Flynn gains were not fully measurement invariant: the cohorts differed in ways that could not be attributed entirely to a rise in the latent abilities, so the gains are partly real ability gains and partly changes in the relation between items and abilities. That undercuts a naive reading in which a 1950 population and a 2000 population differ by a fixed amount of the same thing.
The lesson for the question on this page is precise. A score is a position within a norm sample at a date, and an IQ of 100 in 1950 and an IQ of 100 in 2020 are both the middle of their reference groups and are not the same performance, which is why norms are redrawn and why comparisons across decades and countries, of the kind the page on average IQ by country audits, are fragile. None of this touches the positive manifold, which is present in every cohort, or the within cohort validity that the prediction studies established. It does mean that the construct is a rank within a population, not a quantity like mass, and anyone who calls IQ real should say that in the same breath. A construct can be real and still be a rank; the drift between cohorts is measured, not hidden.
10 The Critiques, Stated Fairly: Reification, Rotation and Gould
The best known critique of IQ, Stephen Jay Gould's The Mismeasure of Man of 1981, makes two arguments, one of which is right and important and the other of which does not survive contact with the statistics. The first argument is reification: that Spearman and his successors took a mathematical abstraction, the first factor of a correlation matrix, and treated it as a physical thing in the head with a location and a cause. As a warning, this is correct. A factor is a summary of covariance, and nothing in factor analysis shows that a single entity produces it; the alternative models in the next section exist precisely because the warning is sound.
The second argument is rotation. Gould pointed out that the axes of a factor solution can be rotated, that Thurstone rotated them to a set of primary mental abilities in which no general factor appeared, and concluded that g is an arbitrary choice of coordinates. John Carroll, whose 1993 survey is the largest factor analytic study of the field, answered this in a retrospective review in Intelligence in 1995. Rotation changes the description of the correlations, not the correlations. When Thurstone's primary factors are allowed to correlate, as they must be to fit the data, they correlate positively with one another, and a second order general factor reappears above them. The general factor is not a coordinate choice; it is the name for the fact that the rotated factors are themselves correlated, and no rotation removes the positive manifold from the matrix. Carroll also noted that Gould's account passed over the predictive validity evidence, which does not depend on any factor solution at all.
There is a third line of critique that is older and more serious than Gould's, and it belongs to Godfrey Thomson. In 1916, in the British Journal of Psychology, Thomson showed that a hierarchy of positively correlated test scores can be produced by tests that each sample a random subset of a very large number of independent elementary bonds, with no general factor at all. Bartholomew, Deary and Lawn gave the model a modern statistical form in Psychological Review in 2009 and argued that it remains a viable account of the same correlation structure. That is a critique of the single entity, not of the measurement.
The popular versions of these critiques are weaker than the originals. The page on common myths about IQ tests deals with the claims that the tests measure only test taking or that the numbers are arbitrary, and the page on types of intelligence with the multiple intelligences proposals, which founder on the manifold: abilities proposed as independent turn out, when measured, to correlate. A serious critic has to accept the manifold and argue about its cause, as Thomson did.
11 Mutualism, Process Overlap and Bonds: g Without a Cause
The serious scientific alternative to a single causal g is not that the manifold is fake but that it is produced by many things, and the two leading models of that kind reproduce the manifold without any g at all. Van der Maas, Dolan, Grasman, Wicherts, Huizenga and Raijmakers published the mutualism model in Psychological Review in 2006. In it, cognitive processes such as memory, reasoning and vocabulary start uncorrelated and grow during development, and each one's growth benefits from the level of the others: a better memory makes reasoning practice more productive, better reasoning makes vocabulary acquisition faster, and so on. The positive manifold emerges from those reciprocal benefits, and a single underlying factor plays no role. The model also reproduces the hierarchical factor structure, the low predictability of adult intelligence from infancy, the rise in heritability with age and the differentiation of abilities at higher levels, findings a g theory claims as its own.
Kovacs and Conway's process overlap theory, in Psychological Inquiry in 2016, takes a different route to the same conclusion. Every cognitive task draws on a set of domain specific processes and on a smaller set of domain general executive processes involved in attention and working memory. Because the executive processes are needed by every task, all tasks overlap in them, and the overlap generates the correlations. On this account g is an emergent property of the overlap, not an ability, and the theory explains why fluid reasoning tasks, which lean hardest on executive attention, have the highest g loadings, a pattern ACIS shows in the .922 loading of its Fluid Reasoning Index against .648 for Processing Speed. The page on the working memory test describes the span tasks on which the executive account rests.
It is essential to see what these models do and do not deny. They deny that the manifold requires a single causal entity. They do not deny the manifold, the reliability, the stability, the prediction or the biological correlates, all of which they take as data to be explained. Under mutualism, a Full Scale score is still the best available summary of a person's cognitive standing, still heritable, still predictive; it is simply a summary of a network rather than a reading of one dial. The same is true of Thomson's bonds.
The reader deciding whether IQ is real should therefore separate two verdicts. The measurement is validated whatever the mechanism turns out to be. The single entity is a hypothesis, and a person who says that g is a thing in the brain has gone beyond what the evidence licenses, in exactly the way Gould warned against.
12 Bias, Norms and What the Number Refers To
The claim that IQ tests are biased is a claim about validity for specific groups, and it has to be tested group by group rather than asserted or denied in general; the major tests pass the statistical tests that have been run, and the norms set limits that a reader should know. Bias in the technical sense means that a score predicts the same criterion differently for members of different groups, or that items function differently for people of equal ability. The American Psychological Association's task force on intelligence, Neisser and ten colleagues, reviewed the evidence in American Psychologist in 1996 and concluded that, considered as predictors of school and work performance within the United States, the major tests did not appear to be biased against Black Americans in that statistical sense, while the cultural and social differences that affect scores remained real and only partly understood. The page on whether IQ tests are biased reviews the methods and the studies since, and the page on culture fair IQ tests explains what nonverbal formats do and do not remove.
Norms are the second limit. A score refers to its reference sample, and a test normed on one population does not automatically describe standing in another. ACIS states its frame: an adult reference sample of 3,243 English speaking records aged 16 to 90, with a mean age of 33.91 in the technical analysis set. An ACIS score is a position within that frame, and the manual does not claim that the frame represents every population, or that a score would be identical on a battery normed elsewhere. Warne and Burningham's finding that the manifold appears in 31 non-Western nations means that the construct travels; it does not mean that any particular norm table does.
The third limit is language and content. The verbal subtests Vocabulary, Antonyms and Synonyms have general factor loadings of .732, .743 and .715 in ACIS, but they are English tasks, and a person tested in a second language will be scored on their English as well as their reasoning. That is not bias in the statistical sense; it is a limit on what the score refers to, and an honest report says so.
Stated together, the three limits do not reduce the construct to an artifact. They specify what a score is a score of: standing on the general factor, within a named population, on tasks in a named language, at a date. That is a great deal narrower than the word intelligence, and it is what a defensible claim that IQ is real has to mean. A number without a stated reference frame, language and error is not a measurement of anything; a number with all three is a measurement whose scope is exactly as wide as the frame.
13 Claims Against Evidence: A Decision Table
The arguments about whether IQ is real recur in a small number of forms, and a table can set each against the evidence that bears on it and the verdict the evidence supports. The verdicts are those of the studies cited above, and the last column names the study or document in which each row is documented.
Claim in circulation
What the evidence shows
Verdict
Where it is documented
IQ is made up; the tests measure nothing
Positive manifold in every sample since 1904; first factor explains 45.9 percent of variance across 31 non-Western nations
False
Spearman 1904; Warne and Burningham 2019
IQ only measures skill at IQ tests
g factors from three and from five different batteries correlate .95 to 1.00 in the same people
False as stated
Johnson and colleagues 2004 and 2008
IQ scores are unreliable
Full Scale reliability .9886 and standard error 1.60 in ACIS; subtests .88 to .95
False
ACIS technical manual
A childhood score says nothing about adulthood
Same test at 11 and 77 correlates .63, about .73 corrected
False
Deary and colleagues 2000
IQ predicts nothing outside the test
Education .56, occupation .45, income .23; examinations .81 latent; mortality hazard ratios 0.72 to 0.84
False
Strenze 2007; Deary and colleagues 2007; Calvin and colleagues 2017
IQ is just socioeconomic status
Mortality gradient attenuated only 10 to 26 percent by childhood socioeconomic status
Mostly false
Calvin and colleagues 2017
g is a single thing in the brain
Manifold reproduced by mutualism and process overlap with no single cause
Unproven
van der Maas and colleagues 2006; Kovacs and Conway 2016
g is an arbitrary rotation
Rotated factors correlate and a second order g reappears; the manifold is rotation invariant
False
Carroll 1995
IQ is a fixed biological constant
Raw scores rose 2.31 points a decade; gains not fully measurement invariant; one to five points per year of schooling
False
Trahan and colleagues 2014; Wicherts and colleagues 2004; Ritchie and Tucker-Drob 2018
IQ is intelligence, full stop
Tests sample reasoning, knowledge, memory and speed; creativity, judgment and character are separate constructs
Overstated
Neisser and colleagues 1996
The column to read is the verdict. Six of the claims in circulation are false on the evidence, one is mostly false, one is an overstatement in the other direction, and one, the single entity, is an open hypothesis that the strongest critics and the strongest defenders both know to be open. A reader who arrives having heard that IQ is pseudoscience should notice that the case against the measurement is not made by any row; a reader who arrives having heard that IQ is intelligence, measured to the point, should notice the last two rows, and the page on what IQ measures draws the boundary of the construct on the side where it is most often overstated.
14 What the Evidence Supports, Stated Narrowly
Stated as narrowly as the evidence allows, IQ is a reliable, stable and predictive measurement of a real statistical regularity in human cognitive performance, and whether that regularity is produced by one cause or many is an open question that the measurement does not need answered. Five sentences carry the positive case. Every cognitive task correlates positively with every other, in every population examined, including 52,340 people in 31 non-Western nations. The general factor extracted from one battery is the same factor extracted from another, to within .95 to 1.00 in the same people. A Full Scale score repeats itself with a reliability near .99 and persists from 11 to 77 at .63. Scores taken in childhood predict examinations at .81, educational attainment at .56, occupational level at .45, job performance at about .31 and death from major causes at hazard ratios of 0.72 to 0.84 per standard deviation. And the scores correlate with reaction time, brain volume and hundreds of genomic loci that no test author chose.
Three sentences carry the limits. A score is a rank within a norm sample at a date, raw performance has risen about 2.31 points a decade, and the rise is not fully measurement invariant, so the number is not a constant of nature. A score describes standing on tasks in a language, within a stated reference frame, and it does not measure creativity, judgment, knowledge outside the tasks or character. And the single causal entity that the letter g is often taken to name is a hypothesis: the manifold is reproduced by mutualism, by process overlap and by Thomson's bonds without it, and no study on this page distinguishes among those accounts.
ACIS sells an assessment, so read this paragraph as a disclosure. ACIS claims that its Full Scale score is a reliable estimate, with a standard error of 1.60 points, of the general factor in an adult reference frame of 3,243 English speaking records, that its six indices load on that factor at .648 to .922 in a confirmatory model with a fit index of .9761, and that its subtests are the kinds of task on which the evidence above was gathered. It does not claim that g is a single entity, that a score is fixed, that its frame represents every population, or that the number measures intelligence in the full sense of the word. The free trial of five subtests and the Quick, Optimized and Full Scale forms, at 15, 30 and 50 dollars, all report against the same frame, and the sibling page on ChatGPT's IQ shows what happens when the tasks are given to something that is not a person: the manifold is a fact about people, and a score outside the population it was normed on refers to nothing.
The answer to the question in the title is therefore yes, with the scope stated. IQ is real as a measurement is real: it tracks a regularity that exists independently of any test, with known precision and known limits. It is not real in the way a heart is real, as a single organ with one location and one function, and nobody who has read the evidence should claim that it is.
Every figure above is linked to its primary source at the point where it is used, and the sixteen sources that carry the main argument are listed here; the critiques and the remaining studies are linked in the sections that discuss them. ACIS reliability, loading, fit and standard error figures are from the technical manual, version 1.4; the conversion of the standard error to a confidence interval is our arithmetic and is labeled as such where it appears.
Spearman C. "General intelligence," objectively determined and measured. The American Journal of Psychology, 1904, volume 15, issue 2, pages 201 to 292.
Warne R T and Burningham C. Spearman's g found in 31 non-Western nations: Strong evidence that g is a universal phenomenon. Psychological Bulletin, 2019, volume 145, issue 3, pages 237 to 272.
Johnson W, Bouchard T J, Krueger R F, McGue M and Gottesman I I. Just one g: consistent results from three test batteries. Intelligence, 2004, volume 32, issue 1, pages 95 to 107.
Johnson W, te Nijenhuis J and Bouchard T J. Still just 1 g: Consistent results from five test batteries. Intelligence, 2008, volume 36, issue 1, pages 81 to 95.
Deary I J, Whalley L J, Lemmon H, Crawford J R and Starr J M. The stability of individual differences in mental ability from childhood to old age: follow-up of the 1932 Scottish Mental Survey. Intelligence, 2000, volume 28, issue 1, pages 49 to 55.
Deary I J and colleagues. Genetic contributions to stability and change in intelligence from childhood to old age. Nature, 2012, volume 482, issue 7384, pages 212 to 215.
Strenze T. Intelligence and socioeconomic success: A meta-analytic review of longitudinal research. Intelligence, 2007, volume 35, issue 5, pages 401 to 426.
Deary I J, Strand S, Smith P and Fernandes C. Intelligence and educational achievement. Intelligence, 2007, volume 35, issue 1, pages 13 to 21.
Sackett P R, Zhang C, Berry C M and Lievens F. Revisiting meta-analytic estimates of validity in personnel selection: Addressing systematic overcorrection for restriction of range. Journal of Applied Psychology, 2022, volume 107, issue 11, pages 2040 to 2068.
Calvin C M, Batty G D, Der G, Brett C E, Taylor A, Pattie A, Čukić I and Deary I J. Childhood intelligence in relation to major causes of death in 68 year follow-up: prospective population study. BMJ, 2017, volume 357, article j2708.
Deary I J, Der G and Ford G. Reaction times and intelligence differences: A population-based cohort study. Intelligence, 2001, volume 29, issue 5, pages 389 to 399.
Pietschnig J, Penke L, Wicherts J M, Zeiler M and Voracek M. Meta-analysis of associations between human brain volume and intelligence differences: How strong are they and what do they mean? Neuroscience and Biobehavioral Reviews, 2015, volume 57, pages 411 to 432.
Savage J E and colleagues. Genome-wide association meta-analysis in 269,867 individuals identifies new genetic and functional links to intelligence. Nature Genetics, 2018, volume 50, issue 7, pages 912 to 919.
Trahan L H, Stuebing K K, Fletcher J M and Hiscock M. The Flynn effect: A meta-analysis. Psychological Bulletin, 2014, volume 140, issue 5, pages 1332 to 1360.
Wicherts J M, Dolan C V, Hessen D J, Oosterveld P, van Baal G C M, Boomsma D I and Span M M. Are intelligence tests measurement invariant over time? Investigating the nature of the Flynn effect. Intelligence, 2004, volume 32, issue 5, pages 509 to 537.
van der Maas H L J, Dolan C V, Grasman R P P P, Wicherts J M, Huizenga H M and Raijmakers M E J. A dynamical model of general intelligence: The positive manifold of intelligence by mutualism. Psychological Review, 2006, volume 113, issue 4, pages 842 to 861.
16 Frequently Asked Questions
Is IQ real?
Yes, as a measurement of a real statistical regularity. Scores on every kind of cognitive task correlate positively, the general factor extracted from different test batteries is the same factor, scores persist from childhood to old age, and they predict education, work and mortality decades later. Whether one cause produces the pattern is a separate, open question.
Is IQ a scientifically valid measure?
It meets the standard criteria of construct validity. Its internal structure is consistent across populations, different instruments converge on the same general factor, Full Scale reliability exceeds .95 on modern batteries, standing is stable across decades, and scores predict independently measured outcomes such as examinations, occupational level and cause of death.
Is intelligence real or a social construct?
The regularity IQ measures is not a social construct: the positive correlations among cognitive tasks appear in 97 samples from 31 non-Western nations as clearly as in Western ones. The scale, the norms and the word intelligence are conventions, and what the tests sample is narrower than the everyday meaning of the word.
Does IQ measure anything real?
Yes. A score that measured nothing could not correlate with reaction time, brain volume and hundreds of genomic loci, persist from age 11 to 77 at .63, or predict death from respiratory and heart disease 68 years later in a whole national birth cohort. Those are properties of a measurement, not of an arbitrary number.
Is IQ pseudoscience?
No. Pseudoscience makes claims that cannot be tested or that fail testing; IQ research makes falsifiable predictions, such as that g factors from different batteries will agree, that childhood scores will forecast adult outcomes, and that norms will drift, and those predictions have been tested and confirmed. What is disputed is the interpretation of g, not the data.
Is g real?
As a statistical regularity, yes: g is the shared variance among all cognitive tasks, it appears in every sample, and it is the same factor whichever battery extracts it. As a single causal entity in the brain, it is unproven; mutualism and process overlap models reproduce the same regularity without any single cause.
Do IQ tests only measure how good you are at taking IQ tests?
No. If that were true, differently built tests would measure different skills, but the general factors from three and from five different batteries correlate .95 to 1.00 in the same people, and scores predict outcomes that have nothing to do with tests, including occupational level, examination results and mortality.
What is the positive manifold?
The finding that scores on every cognitive task correlate positively with scores on every other, whatever their content or format. Spearman documented it in 1904, and Warne and Burningham found a single dominant factor explaining an average of 45.9 percent of test variance across 97 samples from 31 non-Western nations in 2019.
What did the "Just one g" studies find?
Johnson and colleagues gave 436 Minnesota adults three batteries built on different theories and found that the general factors extracted from each correlated .99 to 1.00. A 2008 replication with five batteries in about 500 Dutch seamen found correlations of .95 to 1.00. The g factor does not depend on who wrote the test.
How stable is IQ from childhood to old age?
In 101 Scots who sat the same Moray House test at 11 in 1932 and again at 77, the scores correlated .63, about .73 after correction for range restriction. A 2012 genetic study of 1,940 people found a genetic correlation of .62 between intelligence at 11 and intelligence in old age.
How well does IQ predict education and job performance?
Across longitudinal studies, intelligence correlates .56 with educational attainment, .45 with occupational level and .23 with income. General ability at 11 correlated .81 with examination results at 16 in more than 70,000 English pupils. For job performance the 2022 reanalysis revised the long quoted .51 down to about .31.
Does childhood IQ really predict how long you live?
In 65,765 Scots tested at 11 in 1947 and followed for 68 years, each standard deviation of higher score was associated with hazard ratios of 0.72 for respiratory disease, 0.75 for coronary heart disease, 0.76 for stroke and 0.84 for dementia, attenuated only 10 to 26 percent by childhood socioeconomic status.
What biological measures correlate with IQ?
Four choice reaction time correlates about .49 with test scores and simple reaction time about .31 in a population sample of adults aged 56; brain volume correlates .24 across 88 studies; and a genome wide study of 269,867 people identified 205 loci and 1,016 genes, expressed above all in the brain, associated with intelligence.
What did Gould get right and wrong in The Mismeasure of Man?
Right: a factor is a summary of correlations, and treating it as a physical thing in the head is an unproven step. Wrong: rotating the factor axes does not make g disappear, because the rotated factors themselves correlate and a second order general factor reappears, as Carroll showed in his 1995 review.
Does the Flynn effect show that IQ is not real?
No, it shows that an IQ is a rank within a norm sample at a date, not a constant of nature. Raw performance rose 2.31 points a decade across 285 studies, and the gains are not fully measurement invariant, which is why norms are redrawn. The manifold and the within cohort validity are unaffected.
Is g one thing or many things?
Unknown. The mutualism model of 2006 produces the positive manifold from cognitive processes that reinforce one another during development, with no general factor, and process overlap theory produces it from tasks sharing executive attention processes. Both fit the data that g theory explains, so the single entity remains a hypothesis.
Are IQ tests biased?
Bias in the technical sense means a score predicts differently for different groups or items behave differently at equal ability. The 1996 APA task force found that, as predictors of school and work performance within the United States, the major tests did not appear biased in that sense, while cultural influences on scores remain real.
Does a high heritability mean IQ is fixed?
No. Heritability rises from about 20 percent in infancy to perhaps 80 percent in later adulthood, and yet each additional year of education raises scores by about one to five points and whole populations gained about three points a decade. Heritability describes the share of differences within a population, not how much a score can move.
What does an ACIS score claim to measure?
Standing on the general factor within an adult reference frame of 3,243 English speaking records aged 16 to 90, with a Full Scale reliability of .9886, a general factor loading of .958 and a standard error of 1.60 points. It does not claim that g is a single entity or that the score is fixed.
Can an online IQ test be a real measurement?
Only if it publishes what a measurement requires: a stated norm sample, reliability and standard error for each score, and evidence that its tasks load on the general factor. A number from a quiz without those refers to nothing. A normed online battery that reports them is a measurement with a stated scope.
What is the narrowest honest answer to whether IQ is real?
IQ is a reliable, stable and predictive measurement of a real statistical regularity in human cognitive performance, expressed as a rank within a norm sample at a date. Whether the regularity is produced by one cause or many is unresolved, and the measurement does not need that question answered to be valid.
Take the assessment
You get a profile, not a number
ACIS measures six CHC domains across 20 subtests and reports each one with its own normed score and confidence interval, so you can see where you are strong and where you are not.