Aphantasia and IQ: what the evidence actually shows
Aphantasia is the lifelong absence of voluntary visual imagery. It does not lower measured intelligence. In the one study that tested both imagery extremes with a Wechsler scale, the aphantasia group had the highest mean IQ of the three groups. Visual imagery turns out to be a route to an answer rather than the ability itself.
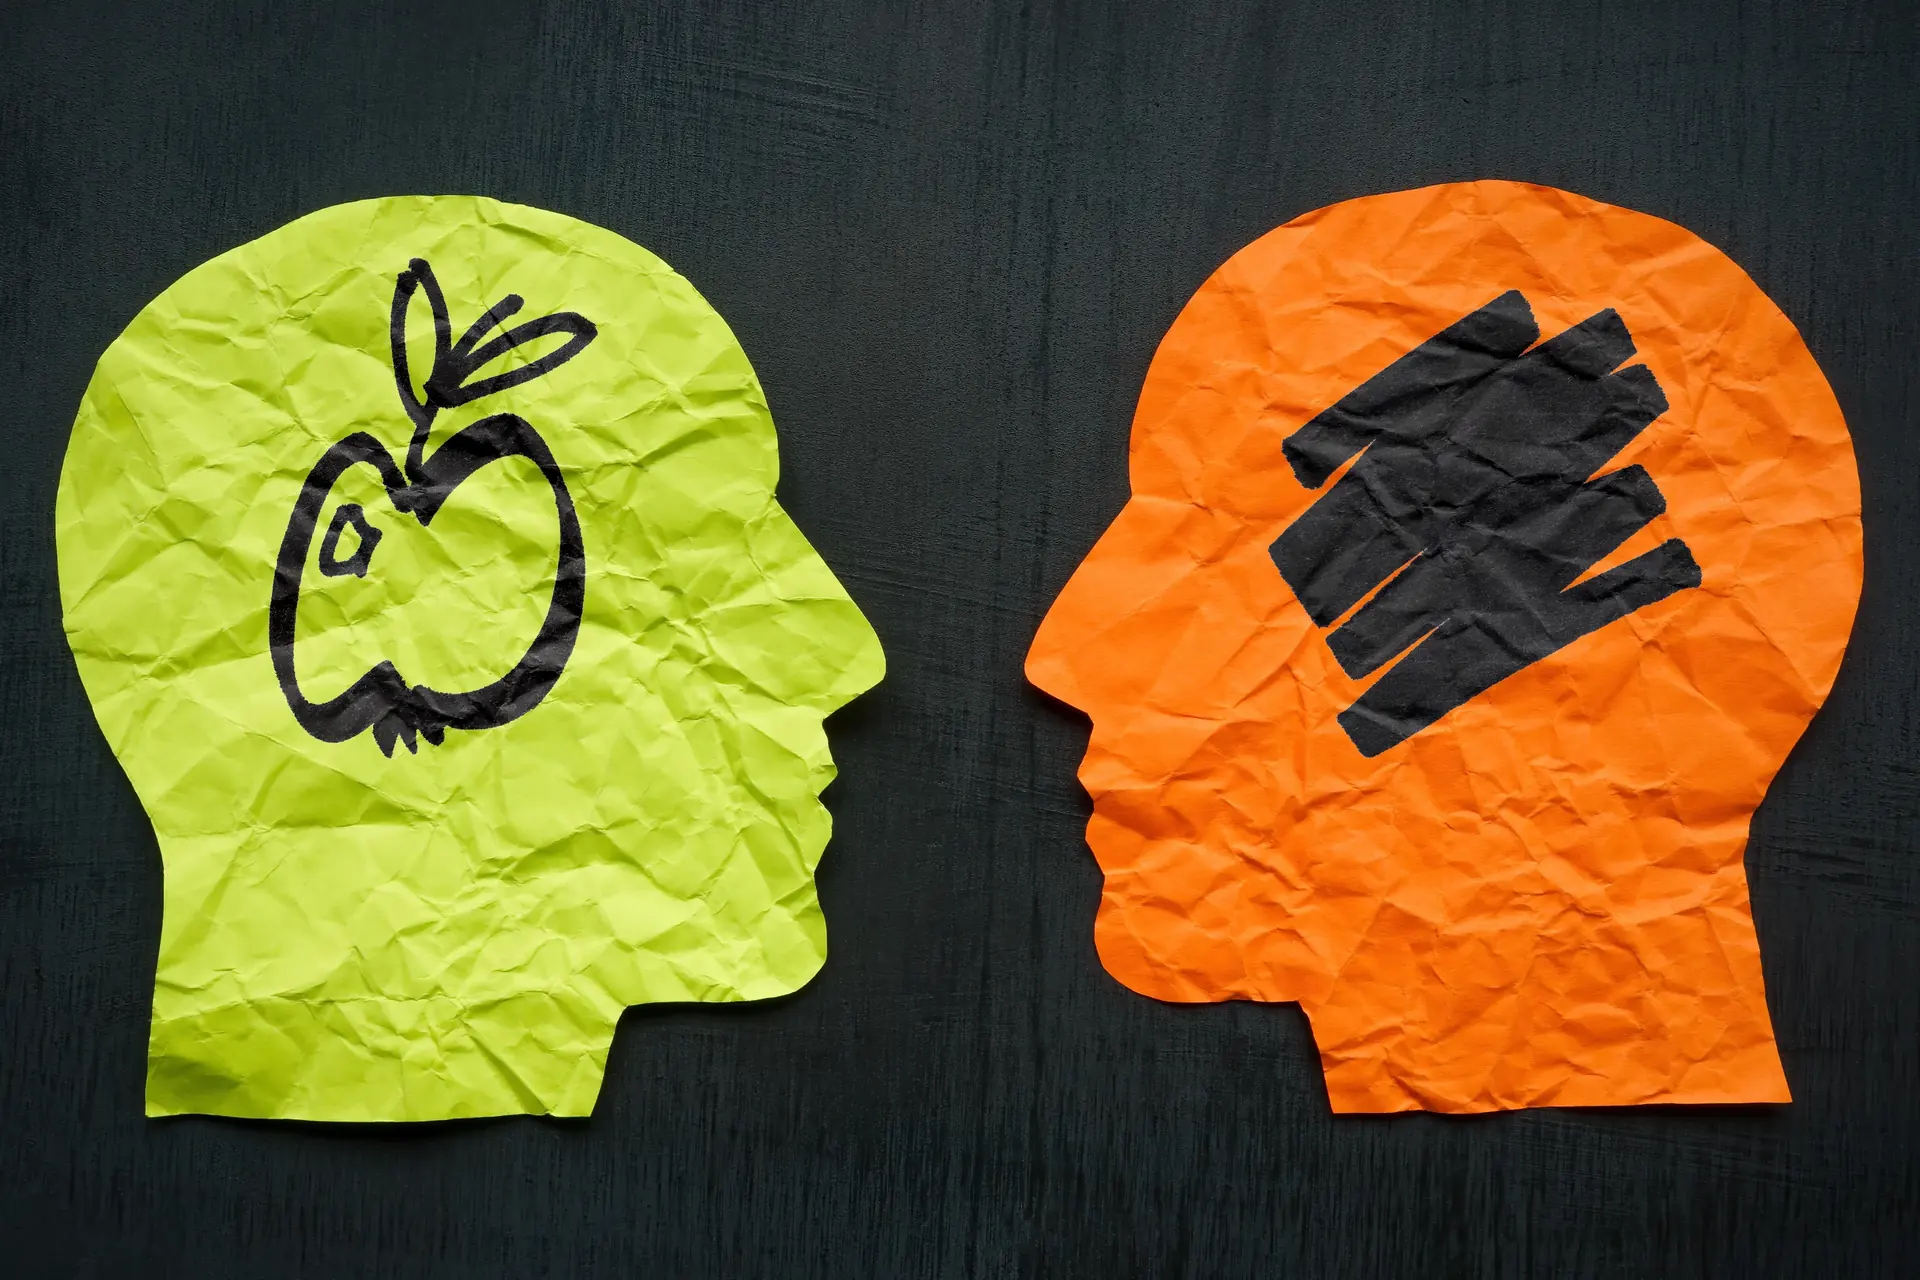
Two routes to the same answer. The score records the answer, not the route.
0 The Short Answer
Aphantasia does not reduce measured intelligence, and the only published study to administer a Wechsler scale across the imagery spectrum found the aphantasia group scoring highest of the three groups it tested. Milton and colleagues, publishing in Cerebral Cortex Communications in 2021, assessed 24 people with aphantasia, 25 with hyperphantasia and 20 with midrange imagery vividness. Mean IQ was 115.46 in the aphantasia group, 110.00 in the midrange controls and 106.32 in the hyperphantasia group.
The honest complication is that this result is smaller than it sounds. The overall test across the three groups was significant, F(2,66) = 5.18, P = 0.008, with a partial eta squared of 0.136. But the only pairwise contrast the authors report as significant is aphantasia against hyperphantasia, at P = 0.002. The gap between aphantasia and the midrange controls, 5.46 points, was not reported as reaching significance, and the whole study rests on 69 volunteers recruited largely because they had written to the research team. Anyone telling you that aphantasic people are measurably smarter is reading a control variable as a headline.
What the evidence does support is more interesting than a score comparison. Visual imagery behaves like a strategy rather than a capacity. People without a mind's eye solve spatial and reasoning problems by other routes, usually verbal, propositional or spatial without pictures, and they arrive at the same answers or better ones. That reframe is what this page is about, and it is also why a single composite score hides the part worth seeing while a profile across the six broad ability domains puts it back on the page.
115.46
Mean IQ of the aphantasia group in Milton et al. 2021, the highest of the three groups tested.
About 4%
Prevalence of aphantasia in two general population samples screened by Dance, Ipser and Simner in 2022.
Zero
Diagnostic systems that list aphantasia as a disorder. It appears in neither the DSM nor the ICD.
Aphantasia is the lifelong absence, or near absence, of voluntary visual imagery: asked to picture a sunset, an apple or a friend's face, the person retains all the knowledge and none of the picture. The term was coined by Adam Zeman and colleagues in a short paper in Cortex in 2015, Lives without imagery: Congenital aphantasia, occupying pages 378 to 380 of volume 73. Milton and colleagues confirm the origin plainly in their own 2021 abstract, writing that they recently coined the terms aphantasia and hyperphantasia to describe visual imagery vividness extremes.
Hyperphantasia sits at the opposite pole. Where an aphantasic person reports no image at all, a hyperphantasic person reports imagery approaching the vividness of ordinary seeing. Both labels mark the ends of a distribution rather than two separate kinds of person, which matters for interpretation: the great majority of people fall between them, and there is no natural break in the middle that a cut score is discovering rather than imposing.
The scale of the phenomenon became clear through self-referral. Zeman and colleagues published Phantasia, the psychological significance of lifelong visual imagery vividness extremes in Cortex in 2020, volume 130, pages 426 to 440, reporting questionnaire data from 2,000 participants with aphantasia and 200 with hyperphantasia who had contacted the team. Three findings from that paper are worth carrying forward. Aphantasia was associated with scientific and mathematical occupations, while hyperphantasia was associated with creative professions. Around half of the aphantasic respondents described an absence of wakeful imagery in every sense modality, not only vision, yet a majority still dreamed visually. And aphantasia ran within families more often than chance would predict.
That last cluster deserves emphasis because it cuts against the usual assumption. A person who cannot picture anything on demand may still see images in dreams, which tells you that the involuntary machinery can be intact while the voluntary route is not. It also tells you that the thing being measured is narrower than most readers assume when they hear that someone has no imagination. Imagination, in the sense of generating novel possibilities, is not the same faculty as generating a picture, and the two dissociate.
LanguageAphantasia is a variation in human experience, not an illness. It is not listed in any diagnostic manual, people with aphantasia are not patients, and phrases like suffers from or affected by misdescribe the situation. This page uses variation throughout, which is also the framing Bainbridge and colleagues use in the title of their own work.
2 The First People Found Without Imagery Were Scientists
The oldest documented cluster of people reporting no mental pictures was not a clinical population. It was a group of scientists, and the man who found them was surprised. Francis Galton circulated a questionnaire about mental imagery in 1880, publishing the results in the Fortnightly Review and in Mind, then folding them into his 1883 book Inquiries into Human Faculty and its Development. The book's own summary of that chapter is unambiguous: the first answers were from scientific men, and were negative; those from persons in general society were quite the reverse. The full text is available from Project Gutenberg.
The replies Galton printed read like modern first person accounts. One respondent wrote that it is only as a figure of speech that a recollection of a scene can be described as a mental image seen with the mind's eye, adding that the memory possesses it and the mind can roam over the whole at will. Another described drawing men and places weeks after seeing them by an effort of memory acting on study at the time, assisted by trial and error on the paper. Those two sentences, written more than a century before anyone coined a term for the condition, describe knowledge without picture and a compensating strategy in the same breath.
Galton's method will not survive modern scrutiny and should not be asked to. His sample was not random, his respondents were selected for eminence, his instrument was an open ended letter rather than a scale, and he had no way to distinguish an absent image from a person who described experience differently. The historical point stands anyway, and it is the point this article turns on. When someone first looked systematically for minds without pictures, the place they turned up was among people doing demanding intellectual work.
It is worth resisting the tidy conclusion that would follow. Galton's finding does not establish that scientists lack imagery more often than other people, because he did not sample any population properly. What it does establish is that the absence is compatible with high level intellectual work, and that this was visible from the very first inquiry. The occupational pattern in Zeman's 2020 questionnaire data, aphantasia clustering in scientific and mathematical work, echoes Galton across 140 years, and inherits exactly the same self selection problem.
3 The Study That Measured Both Extremes
Milton and colleagues ran the first systematic neuropsychological and brain imaging comparison of the two imagery extremes against a midrange group, and it remains the reference point for anything said about aphantasia and intelligence. The paper, Behavioral and Neural Signatures of Visual Imagery Vividness Extremes, appeared in Cerebral Cortex Communications in 2021, volume 2, article tgab035. General intelligence was assessed with the Wechsler Abbreviated Scale of Intelligence or the Wechsler Adult Intelligence Scale.
Group separation on the imagery measure itself was total. Vividness of Visual Imagery Questionnaire scores were 16.92 in the aphantasia group, 56.95 in controls and 77.08 in the hyperphantasia group, with a partial eta squared of 0.994. That is close to the largest effect size anyone ever reports, and it is a reminder that the grouping variable here is a self report scale, separating people almost perfectly because people were selected on it.
Measure
Aphantasia (n = 24)
Midrange controls (n = 20)
Hyperphantasia (n = 25)
Group test
IQ (Wechsler)
115.46 (SD 12.54)
110.00 (SD 11.41)
106.32 (SD 4.51)
F(2,66) = 5.18, P = 0.008
Imagery vividness (VVIQ)
16.92 (SD 1.47)
56.95 (SD 2.93)
77.08 (SD 1.75)
F(2,66) = 5245.53, P below 0.001
Manikins spatial task, out of 32
30.42 (SD 3.16)
29.75 (SD 2.47)
31.20 (SD 1.78)
F(2,66) = 1.85, P = 0.165, no difference
Self reported face recognition difficulty (PI-20)
55.71 (SD 13.23)
43.30 (SD 14.24)
38.72 (SD 8.48)
F(2,66) = 12.83, P below 0.001
Famous faces recognition, performance test
No group difference
No group difference
No group difference
F(2,66) = 0.67, P = 0.516
Autobiographical memory, remote period
Lowest
Middle
Highest
F(2,66) = 27.74, P below 0.001
Two rows of that table do most of the work. The Manikins task requires deciding which hand a figure is holding an object in, which means adopting the figure's viewpoint, and the aphantasia group did it as accurately as everyone else. Meanwhile the face recognition rows split: aphantasic participants reported far more difficulty with faces, yet on an actual famous faces test the three groups were indistinguishable. The subjective complaint and the objective performance came apart, which is a pattern worth remembering whenever a self report is the only evidence on offer. For the broader point about self assessment and ability, see how memory and measured intelligence relate.
The imaging results ran in the expected direction without settling anything about capacity. Resting state functional MRI showed stronger connectivity between prefrontal cortices and the visual network in hyperphantasic than in aphantasic participants, and an active paradigm comparing visualization of famous faces and places against perception showed greater anterior parietal activation in the hyperphantasia and control groups than in the aphantasia group. Different machinery is being recruited. Nothing there says the machinery is weaker. That caution has been tested inside a single cohort rather than merely asserted: in Whitehall II the same broad sample showed dose dependent hippocampal atrophy at moderate alcohol intake and no faster cognitive decline at that same intake, which makes a tissue difference that never became a performance difference a documented outcome rather than a hypothetical one.
4 How to Read That IQ Difference Honestly
The IQ finding is real, small, and routinely overstated in both directions, and the fastest way to see why is to look at where the participants came from. Milton and colleagues describe recruiting the aphantasia and hyperphantasia groups from spontaneous email contacts to the research team, from the Extend Biobank and from members of the university community. The 20 midrange controls, with vividness scores between 55 and 60, came from a local biobank. In other words the two extreme groups largely selected themselves by writing in after reading about the research, and the comparison group did not.
That asymmetry cuts in a specific direction. People who read a science article, recognize themselves in it and email a professor are not a random draw from anyone. They skew toward higher education, higher verbal engagement and more interest in their own cognition, all of which correlate with test performance. A five point advantage over a differently recruited control group is exactly the size of effect that recruitment can manufacture on its own. Anyone quoting the number as evidence that aphantasia confers an advantage has skipped the methods section.
The reverse error is just as common. A reader who learns that the sample was self selected sometimes concludes that nothing can be inferred at all. That is too strong. The finding that survives is a null one, and null findings are less sensitive to this kind of bias: whatever recruitment did to the means, there is no sign anywhere in this study that the absence of visual imagery costs performance. The aphantasia group matched everyone else on standard anterograde memory tests, on the Manikins task, on curved segments and on famous face recognition. If the mind's eye were load bearing for general ability, 24 people without one should have shown it somewhere.
What a control variable is forMilton and colleagues did not set out to test whether aphantasia raises IQ. They measured intelligence so that group differences in memory and imagination could not be dismissed as ability differences in disguise, which is standard practice. Treating that background measure as the study's headline finding inverts the design. The correct summary is that ability was measured, checked, and found not to explain the differences that the study was actually about.
One more caution belongs here. A partial eta squared of 0.136 on 69 people is an estimate with wide uncertainty around it, and the hyperphantasia group's standard deviation of 4.51 is strikingly narrow next to 12.54 in the aphantasia group. Narrow variance in one cell makes an omnibus test easier to pass and harder to interpret. This is the kind of result that needs replication in a sample recruited the same way for every group, and that study has not been published. For how measurement error and sample composition shape any score comparison, read what reliability and validity actually require.
5 Visual Imagery Is a Strategy, Not a Capacity
The strongest evidence in this whole literature comes from mental rotation, because mental rotation was supposed to be the task that imagery was indispensable for, and it is not. Kay, Keogh and Pearson tested a large group of people with aphantasia on two rotation tasks, a three dimensional block shape task and a human manikin task, and published the result in Consciousness and Cognition in 2024, volume 121, article 103694. Their finding is the article you are reading, in one sentence: in both tasks, participants with aphantasia were slower but more accurate than controls. The paper is indexed on PubMed.
The detail underneath that headline is what makes it a strategy finding rather than a scoring quirk. Both groups showed the classic linear increase in response time and error rate as the angular disparity between the two shapes grew, which is the signature that something is being rotated rather than guessed. Within the control group there was the usual speed accuracy trade off, faster people being less accurate. Within the aphantasia group that trade off reversed: the faster individuals were also the more accurate ones. And when asked how they had solved the items, control participants generally favoured object based rotation strategies while participants with aphantasia favoured analytic ones, working from features and rules rather than turning a picture.
Pounder and colleagues reached a compatible conclusion by a different route in Cortex in 2022, volume 148, pages 180 to 192, under the title Only minimal differences between individuals with congenital aphantasia and those with typical imagery. Twenty people with congenital aphantasia, all scoring below 25 on the vividness questionnaire, were matched to twenty people with typical imagery on age and on IQ, then run through the Cambridge Neuropsychological Test Automated Battery. Across Spatial Span, Pattern Recognition Memory, Verbal Recognition Memory and mental rotation, accuracy did not differ. A response time difference appeared on the One Touch Stocking of Cambridge planning task as the number of imagined moves grew, and on mental rotation, but only within the subgroup whose vividness score was the floor value of 16.
Put the two studies together and the picture is consistent. The route changes, the timing changes, the answer does not. That is the definition of a strategy difference. It also explains why the imagery literature spent decades treating rotation tasks as imagery measures: for most people rotation is done by imagery, so the correlation holds, right up until you test the people for whom it cannot be. Kay and colleagues draw the conclusion explicitly, that visual imagery is not crucial for successful performance in classical mental rotation tasks because alternative strategies can be used effectively in the absence of holistic mental representations. If you want to see what a rotation style item looks like in practice, the Visual Puzzles subtest page describes one format in detail.
6 Object Imagery and Spatial Imagery Come Apart
The reason aphantasic people keep matching controls on spatial tasks is that visual imagery and spatial imagery are two different things, and only one of them is missing. Keogh and Pearson made this concrete in Cortex in 2018, volume 105, pages 53 to 60, in a study titled The blind mind: No sensory visual imagery in aphantasia. They used binocular rivalry priming, which is an objective behavioural measure rather than a questionnaire: imagining a pattern biases which of two competing images you subsequently see. Experimentally naive aphantasic participants showed almost no imagery based rivalry priming, confirming that something sensory really is absent rather than merely unreported.
The second half of that result is the part almost nobody quotes. Alongside the rivalry task, participants completed the vividness questionnaire, the Spontaneous Use of Imagery Scale and the Object Spatial Imagery Questionnaire. Their self rated visual object imagery was significantly below average, exactly as expected. Their spatial imagery scores were above average. One channel is gone and the other is, if anything, stronger than typical.
Bainbridge, Pounder, Eardley and Baker demonstrated the same dissociation behaviourally in Cortex in 2021, volume 135, pages 159 to 172, in Quantifying aphantasia through drawing. Sixty one people with aphantasia and matched controls studied photographs of real world scenes, drew them from memory, then copied the same scenes with the image in front of them. The drawings were scored by 2,795 online raters. Aphantasic participants recalled significantly fewer objects, used less colour, and relied more on written labels inside the drawing, which the authors call verbal scaffolding. Their spatial accuracy was equivalent to controls, and they made significantly fewer memory errors, meaning fewer objects drawn that had not been there. None of these differences appeared in the copying condition, where the picture was visible.
Fewer errors is not a consolation prizeDrawing objects that were never in the scene is a false memory, and typical visualizers produced more of them. A representation that stores what was verifiably present, without filling gaps with plausible detail, is more faithful on that dimension. The aphantasic drawings were sparser and more correct at once, which is the shape of a genuine trade off rather than a deficit.
The 2024 systematic review by Jin and colleagues in Vision, A Systematic Review of Aphantasia, treats this split as the field's central open question and reports that some researchers now propose separate object and spatial subtypes. It also records the pattern that matters for testing: across studies, participants with aphantasia showed equal or even higher accuracy on mental rotation tasks while requiring longer response times, and the explanation offered is that they employ non visual processes. For how these abilities are grouped in the standard framework, see the Cattell Horn Carroll structure and the distinction between fluid reasoning and crystallized knowledge.
7 How Aphantasia Is Identified, and What That Costs
Aphantasia is identified almost entirely by a sixteen item self report questionnaire, which means the boundary of the category is a threshold somebody chose rather than a fact somebody found. The instrument is the Vividness of Visual Imagery Questionnaire, published by David Marks in the British Journal of Psychology in 1973, volume 64, pages 17 to 24, under the title Visual imagery differences in the recall of pictures. Respondents picture four scenes, rate the vividness of specific details on a five point scale, and receive a total between 16 and 80. Sixteen means every image was rated as no image at all.
Because the cut score is a choice, the prevalence estimate moves with it, and the published range is wide enough to be confusing if you do not know that. Jin and colleagues assembled the estimates in their 2024 review, and the spread is entirely explained by the criterion. Moving a cut does more than move a prevalence. Splitting a normally distributed continuous variable at its mean multiplies any correlation it can then show with anything else by .798 and costs the statistical power of discarding roughly 36 percent of a sample, arithmetic worked through for the four letter labels in the case against reporting a type instead of a position.
Criterion used
Prevalence reported
Source and sample
VVIQ exactly 16, complete absence
0.7 percent
Zeman and colleagues, reported in Jin et al. 2024
VVIQ 16 to 23, moderate aphantasia
2.6 percent
Zeman and colleagues, reported in Jin et al. 2024
VVIQ 16 to 32
3.9 percent combined
Dance, Ipser and Simner 2022, two samples of 502, giving 4.2 and 3.6 percent
Meta-analysis across VVIQ studies
3.5 percent
Monzel, Vetterlein and Reuter, 3,543 participants
Meta-analysis across all measures
4.8 percent
Monzel, Vetterlein and Reuter, 3,543 participants
Self reported, then confirmed by questionnaire
8.9 percent falling to 1.5 percent
Single study cited in Jin et al. 2024
The Dance, Ipser and Simner estimate is the cleanest of these, because it was built to avoid the recruitment problem that shapes everything else in the field. Publishing in Consciousness and Cognition in 2022, volume 97, article 103243, they screened a cohort of 502 undergraduates and then a second independent sample of 502 people from an online crowdsourcing marketplace, finding 4.2 percent and 3.6 percent respectively, combining to 3.9 percent across more than a thousand people with no gender difference. Nobody in either sample volunteered because they already knew they had it.
The limitation underneath all of this is structural and does not go away with a better cut score. The questionnaire asks a person to rate the vividness of a private experience against a scale whose anchors are words. There is no external criterion, no way to check one person's four against another's, and no independent standard the report can be validated against. Jin and colleagues raise exactly this concern, noting a possible metacognitive component in which some respondents may have imagery but describe it differently. Keogh and Pearson's rivalry data pushes back hard, showing an objective behavioural difference in the expected direction, but one paradigm in one laboratory is not the same as a validated diagnostic. Every psychometric instrument faces a version of this problem, which is why the way norms are constructed matters as much as the items do.
8 A Variation, Not a Disorder
The question of whether aphantasia is a clinical condition has been formally tested against the criteria that define one, and the answer was no. Monzel, Vetterlein and Reuter published No general pathological significance of aphantasia in the Scandinavian Journal of Psychology in 2023, volume 64, pages 314 to 324. They evaluated aphantasia against four standard criteria for a mental disorder: statistical rarity, impairment in activities of daily living, violation of social norms or inappropriate behaviour, and personal distress. An international sample of 156 participants with aphantasia and 131 controls completed measures of everyday memory, theory of mind, depression, anxiety, well being and a purpose built distress questionnaire.
Aphantasia met the rarity criterion, which is trivially true of anything occurring in a few percent of people, and failed the rest. Participants with aphantasia scored lower than controls on everyday and autobiographical memory, but not on theory of mind, and the authors concluded that the impact on activities of daily living and personal distress is too weak to justify classification as a mental disorder. It appears in neither the DSM nor the ICD, and nothing in the literature is pushing for that to change.
The paper does not leave it at a clean bill of health, and neither should this page. A subgroup of 34.7 percent of the aphantasic participants reported distress that was significantly associated with lower well being and higher levels of anxiety and depression, and the level of distress rose as autobiographical memory performance fell. The authors' recommendation is proportionate: in individual cases a psychological assessment may be advisable, using their distress questionnaire, while the category as a whole stays outside the clinical frame. Difference for most, difficulty for some, disorder for the category as a whole is not the summary a headline wants, but it is the one the data supports.
This is the same posture the site takes with other neurological variations. Test scores describe performance on specified tasks under specified conditions and nothing more, which is why the pages on autism and measured ability, ADHD and test performance and dyslexia and reading dependent subtests all separate what a profile shows from what a label means. The twice exceptional pattern makes the same point from the other direction, where a strength and a difficulty in one person can cancel out in a composite and disappear from view. Aphantasia belongs in that family of topics rather than in a clinical one.
9 What Does Differ, Stated Precisely
Saying that aphantasia does not lower intelligence is not the same as saying nothing is different, and the differences that do replicate are specific enough to name. Three areas come up consistently across the studies covered here, and all three sit outside what an intelligence battery is built to measure.
Autobiographical memory is the clearest. In Milton and colleagues, internal detail in recalled personal events differed sharply by group for both recent events, F(2,66) = 13.67, and remote events, F(2,66) = 27.74, with hyperphantasic participants above controls and aphantasic participants below. Monzel and colleagues found the same direction in an entirely separate sample. Recalling a specific past episode with its sensory texture is a different operation from knowing a fact about your own past, and it is the first that is affected. The knowledge is intact; the re-experiencing is not.
Imagination of scenes shows the largest effects in the whole Milton dataset. Atemporal imagination, imagining a scene unmoored from time, produced a partial eta squared of 0.73, and imagining future events produced 0.56. Both are tasks scored for the number of internal descriptive details a person generates, which rewards the ability to inspect an image and report what is in it. A person who has no image to inspect will produce fewer details by construction, so a large part of this effect is the task measuring its own prerequisite.
Face recognition is the interesting one, because it splits by method. Self reported difficulty was much higher in the aphantasia group, at 55.71 on the Prosopagnosia Index against 43.30 in controls. Performance on an actual famous faces test showed no group difference at all. A rating and a result coming apart is the normal case rather than a quirk of this sample, since pooled across 41 published studies what people believe about their own cognitive standing correlates about .33 with what a test records, and the distance between a self rating and a measurement is wide enough to produce exactly this split. Both facts are true, and the resolution is probably that recognising a face when it is in front of you is a different operation from summoning one in its absence, and only the second requires an image. Autistic spectrum traits were also reported more often, with a mean Autism Quotient of 22.04 against 14.20 in controls, which is a questionnaire association in a self selected sample rather than a rate of anything.
What did not differ is equally worth listing. Standard anterograde memory tests, including logical memory immediate recall, delayed recall and recognition, and the Rey Osterrieth Complex Figure for both copy and delayed recall, showed no group differences. Neither did the Manikins task, in which a figure holding a disk is shown upright or inverted and facing towards or away and the participant names the hand, nor the curved segments task, nor performance based face recognition. One task sat on the line: animal tails, which asks whether a named animal has a long or short tail for its body, came in at F(2,66) = 3.07, P = 0.053, with aphantasic participants averaging 32.92 of 40 against 34.05 in controls. Reporting that borderline result matters, because a page that lists only the clean nulls is selecting its evidence. For how the site treats memory claims generally, including the ones that run in the opposite direction, see the page on whether photographic memory exists and the related account of savant abilities.
10 Why One Composite Hides the Interesting Part
A Full Scale IQ is a weighted average, and averages are built to discard exactly the information this topic is about. If a person's visual spatial performance is produced by an unusual route while their verbal and quantitative performance is produced by the ordinary one, the composite records the sum and forgets the structure. Two people can arrive at the same number with entirely different shapes underneath, and the number cannot tell you which you are looking at.
This is not a special pleading for aphantasia. It is a general property of composite scores that happens to bite here. Anyone whose abilities are unevenly distributed loses information to averaging, which is why a battery reports index scores at all rather than stopping at one figure. The relevant contrast for this page is between comprehension knowledge, Gc, and visual spatial ability, Gv, since the imagery literature predicts a difference in how the second is reached and no difference in the first. A single composite cannot express that sentence. A profile across the Full Scale composite and its constituent indices can.
The ACIS structure is 20 subtests across six primary cognitive domains, reported as VCI, FRI, QRI, VSI, WMI and PSI, with subtest scaled scores on a mean of 10 and standard deviation of 3 and composites on a mean of 100 and standard deviation of 15. The Full Scale IQ composite has an omega of .9886, a g loading of .958, and a standard error of measurement of about 1.60 IQ points, computed on a technical analysis set of 2,750 complete records within an adult reference frame of 3,243 English speaking records aged 16 to 90. ACIS is a self-administered assessment. For the scale those numbers sit on, read why the standard deviation is fifteen, and for the composite's meaning, the general factor and what it summarizes.
The honest version of the ACIS angleA domain profile is more informative than a single number for anyone whose abilities are unevenly distributed. That is a general truth about composite scores which happens to apply to this topic. It is not a claim that ACIS detects aphantasia, measures imagery, or can tell you anything about your mind's eye. It cannot, it does not try, and no score pattern it produces should be read as evidence about imagery vividness.
The practical consequence is modest and worth stating plainly. If you have aphantasia and you take any cognitive battery, the useful output is the shape of the profile and the size of the differences between indices, read against the percentile equivalents rather than in raw points. What the profile will not tell you is why any index landed where it did, because a score records an answer and not the route taken to it.
11 How ACIS Measures Visual Spatial Ability
The visual spatial index on ACIS is built from three subtests that make different demands, which is precisely why they can diverge within one person. Naming them concretely is more useful than an abstract description, because the format determines which strategies are available.
Visual Puzzles. A completed figure is shown and the examinee selects the three pieces that would reconstruct it. Pieces may be mentally rotated but not reflected, so the demand is on part to whole relations. Speed, visual scanning and strategy all affect it. Assembly items of this kind are a staple of language reduced test formats, and the subtest page linked earlier carries the full specification.
Layer Rotation. Several transparent layers of a square grid are shown together, each carrying a tab on one edge, and the examinee turns every layer in the mind until its tab is upright, superimposes them, and selects the resulting figure from eight options. Later items add layers and finer grids, so more transformations have to be held together at once. Because the layers stay on screen throughout, the demand falls on transforming and combining them rather than on remembering what was there. The Layer Rotation page describes the format.
Spatial Comprehension. Directional and geometric items using standard compass convention, with a knowledge sheet defining the required terms available before the subtest begins, so performance reflects visualization conducted with those terms rather than vocabulary familiarity.
A fourth subtest that people assume belongs here does not. Visual Sequence, in which a sequence of tiles flashes and is reproduced forwards and then in reverse, uses spatial material but loads on working memory, and is reported under WMI rather than VSI alongside Digit Span. Material is not the same thing as construct, and mistaking one for the other is a common way to misread a profile. The verbal side, sampled by subtests such as Vocabulary and Similarities, is a different domain again, and the guide to what each subtest format is for lays out the full mapping.
Here is the boundary, stated as directly as possible. None of these three subtests records how an examinee reached an answer. A person who rotates a picture and a person who applies a rule about relative bearings both produce a keystroke, and the scoring cannot separate them. That is a limitation of every visual spatial measure in wide use, not a peculiarity of this one, and it is the same limitation that made rotation tasks look like imagery tasks for forty years. ACIS is a self-administered online assessment, not a clinical or diagnostic instrument, and it does not detect, diagnose or measure aphantasia in any form.
The field is roughly ten years old as a named research area, the samples are small, and the questions a reader most wants answered are mostly the ones nobody has designed a study for. Listing the gaps is more useful than papering over them.
No study has been designed to test whether imagery vividness relates to measured intelligence. The Milton result exists because IQ was collected as a background variable in a study about memory and imagination, and Pounder and colleagues deliberately matched their groups on IQ, which by design removes the comparison. There is no adequately powered study that recruited aphantasic and typical participants by the same route and administered a full battery as the primary outcome. Until one exists, the correct statement is that no cost has been found, not that an advantage has been established.
Recruitment shapes almost everything. The 2,000 respondent questionnaire in Zeman's 2020 paper, the email contacts in Milton's sample, and most online aphantasia studies draw from people who identified themselves after encountering the concept. That route selects for introspective interest and for internet use, and it is the reason the occupational pattern, aphantasia clustering in scientific and mathematical work, cannot be read as a population fact. Dance, Ipser and Simner's prevalence work is the exception that shows what unbiased screening looks like, and it covers prevalence only.
The object and spatial split is still being carved. Jin and colleagues report three different outcome patterns across studies, with some samples showing intact spatial imagery alongside impaired object imagery, some showing better spatial performance, and some showing weakness in both, and the proposal of separate object and spatial subtypes is a hypothesis rather than a settled taxonomy. Nothing about causation is known either. Aphantasia runs in families more than chance predicts according to Zeman's 2020 data, but no mechanism has been established, and family aggregation is not the same as a genetic account.
Finally, this site has published nothing about aphantasia from its own data and will not. ACIS does not collect imagery vividness, has no aphantasia subgroup, and any number it produced on this topic would be invented. That constraint is deliberate: the psychometric figures published here come from the technical manual and nothing else. If you are weighing what an unsupervised battery can and cannot support in general, the accuracy of online testing and the comparison with supervised administration set out the boundaries, and the myths page handles the claims that recur most often.
Cut scores move prevalence in other traits too. Left-handedness is estimated at 9.3 percent under the strictest criterion and 18.1 percent under the most lenient one in a 2020 meta-analysis, and the best overall estimate is 10.6 percent. Because definitions differ, studies of ability in these groups are hard to compare, as the review of left-handedness and IQ shows.
13 Standards, Boundaries and Responsible Use
Everything above is a description of group findings, and group findings never license a statement about an individual. A prevalence of about four percent tells you nothing about whether you have aphantasia. A mean of 115.46 in one small self selected group tells you nothing about what any aphantasic person will score. And a score from any battery, taken alone at a screen, tells you nothing about imagery at all. Those three sentences are the whole of the responsible reading.
If you recognise yourself in this page, the reasonable next steps are modest. Nothing needs fixing, since aphantasia is a variation rather than a condition, and the Monzel evaluation found no general pathological significance. If the recognition comes with genuine distress, which happened to about a third of the aphantasic participants in that study, that distress is worth raising with a clinician in its own right and not as a symptom of imagery. If you are simply curious about your own cognitive profile, an assessment that reports domain level indices will show you shape, and shape is the part that a single figure loses. Start from what a given score actually indicates rather than from a target number.
The boundaries that govern this are not house preferences. The Standards for Educational and Psychological Testing, published jointly in 2014 by the American Educational Research Association, the American Psychological Association and the National Council on Measurement in Education, ties every claim a test makes to evidence for the specific interpretation being asserted, for the specific population, in the specific conditions of administration. There is no validity evidence anywhere connecting an intelligence battery to imagery vividness, so no such interpretation may be offered. The APA's own overview of testing and assessment standards states the same principle for practitioners, and the International Test Commission guidelines on test use extend it to unsupervised and remote delivery, where control over conditions is weakest.
Applied here, those standards produce a short list of things this page will not do. It will not treat a self-administered score as a clinical finding. It will not describe a variation as a deficit. It will not convert a self report questionnaire into a diagnosis. It will not report an ACIS statistic that is not in the published technical manual. And it will not claim that any score pattern reveals how a person thinks, because the evidence in this article is precisely that the same answer can be reached by more than one route, and the answer is all a test records. For the wider context of where an online battery sits among instruments, see the WAIS-5, Raven's 2 and the site's account of what makes an online assessment defensible.
14 Frequently Asked Questions
Does aphantasia affect IQ?
There is no evidence that it lowers measured intelligence. In the only study to administer a Wechsler scale across the imagery spectrum, Milton and colleagues in 2021, the aphantasia group had the highest mean of the three groups tested, at 115.46 against 110.00 for midrange controls.
Are people with aphantasia smarter?
That claim goes well beyond the evidence. The one relevant study had 69 volunteers, recruited its extreme groups largely from people who wrote in after reading about the research, and reported only the aphantasia versus hyperphantasia contrast as significant. Recruitment alone could produce a gap that size.
What is aphantasia?
It is the lifelong absence or near absence of voluntary visual imagery. Asked to picture a face or a sunset, the person keeps every fact about it and gets no picture. Adam Zeman and colleagues named it in Cortex in 2015.
What is hyperphantasia?
The opposite extreme, in which mental imagery approaches the vividness of ordinary seeing. Zeman's 2020 questionnaire study found it associated with creative professions, while aphantasia was associated with scientific and mathematical ones. Both are ends of a continuous distribution, not separate categories.
How common is aphantasia?
About four percent by current best screening. Dance, Ipser and Simner screened two independent samples of 502 people in 2022 and found 4.2 and 3.6 percent, combining to 3.9 percent with no gender difference. Stricter cut scores give lower figures, down to 0.7 percent.
How is aphantasia measured?
Almost always with the Vividness of Visual Imagery Questionnaire, published by David Marks in 1973. Respondents picture four scenes and rate specified details on a five point scale, producing a total from 16 to 80. Sixteen means no image was experienced at any point.
Is the VVIQ a reliable diagnosis?
It is a self report of a private experience with no external criterion, so it cannot function as a diagnosis. Different research groups use different cut scores, which is the entire reason published prevalence figures range from under one percent to about five.
Can aphantasic people do mental rotation?
Yes, and often more accurately. Kay, Keogh and Pearson found in 2024 that aphantasic participants were slower but more accurate than controls on both a block shape and a manikin rotation task, with the same linear response cost as the rotation angle grew.
How do they solve spatial problems without pictures?
By analytic and propositional routes. Asked about strategy, controls in the Kay study generally reported object based rotation while aphantasic participants reported feature and rule based approaches, tracking relations verbally or symbolically rather than turning an image.
Is spatial ability the same as visual imagery?
No, and aphantasia is the clearest demonstration. Keogh and Pearson found in 2018 that aphantasic participants rated their object imagery well below average while rating their spatial imagery above average, with objective rivalry testing confirming the sensory absence.
Does aphantasia affect memory?
It affects autobiographical recall rather than memory generally. Standard anterograde tests, including logical memory and the Rey Osterrieth figure, showed no group differences in Milton's study, while recalling internal detail from personal events differed sharply.
Do people with aphantasia dream in pictures?
Most do. Zeman's 2020 survey of 2,000 aphantasic respondents found that around half described no wakeful imagery in any sense modality, yet a majority still dreamed visually. The involuntary route can work when the voluntary one does not.
Is aphantasia a disorder?
No. Monzel, Vetterlein and Reuter tested it against the four standard criteria for a mental disorder in 2023 and concluded that the impact on daily living and personal distress is too weak to justify classification. It appears in neither the DSM nor the ICD.
Can aphantasia cause distress?
For some people, yes. In the Monzel study, 34.7 percent of aphantasic participants reported distress associated with lower well being and higher anxiety and depression, with distress rising as autobiographical memory performance fell. That subgroup may warrant individual psychological assessment.
Is aphantasia linked to autism?
Autistic traits were reported more often in Milton's aphantasia group, with a mean Autism Quotient of 22.04 against 14.20 in controls. That is a questionnaire association within a self selected sample of 69 people, not a rate and not a causal link.
Why do aphantasic people report face recognition problems?
Self reported difficulty was much higher in Milton's aphantasia group, yet performance on an actual famous faces test showed no group difference. Recognising a face in front of you appears to be a different operation from summoning one in its absence.
Does ACIS test for aphantasia?
No. ACIS does not collect imagery vividness, does not diagnose or detect aphantasia, and produces no score that should be read as evidence about a mind's eye. It is a self-administered online assessment of cognitive performance, not a clinical instrument.
Would aphantasia lower a visual spatial index score?
There is no evidence that it does. Across the published studies, accuracy on spatial and rotation tasks matched or exceeded that of typical visualizers, with differences appearing in response time rather than correctness.
Why does a domain profile matter here?
Because a composite is an average and averages discard structure. For anyone whose abilities are unevenly distributed, index level scores show shape that a single figure loses. That is a general property of composites, not a claim about imagery.
Is aphantasia inherited?
It aggregates in families more often than chance predicts, according to Zeman's 2020 questionnaire data. No mechanism has been established, and family clustering in a self referred sample is a long way from a genetic account.
What is still unknown about aphantasia and intelligence?
Almost everything that matters. No study has been designed with cognitive ability as the primary outcome, no sample has recruited both groups by the same route, and the split between object and spatial imagery remains a hypothesis rather than a settled taxonomy.
Take the assessment
You get a profile, not a number
ACIS measures six CHC domains across 20 subtests and reports each one with its own normed score and confidence interval, so you can see where you are strong and where you are not.