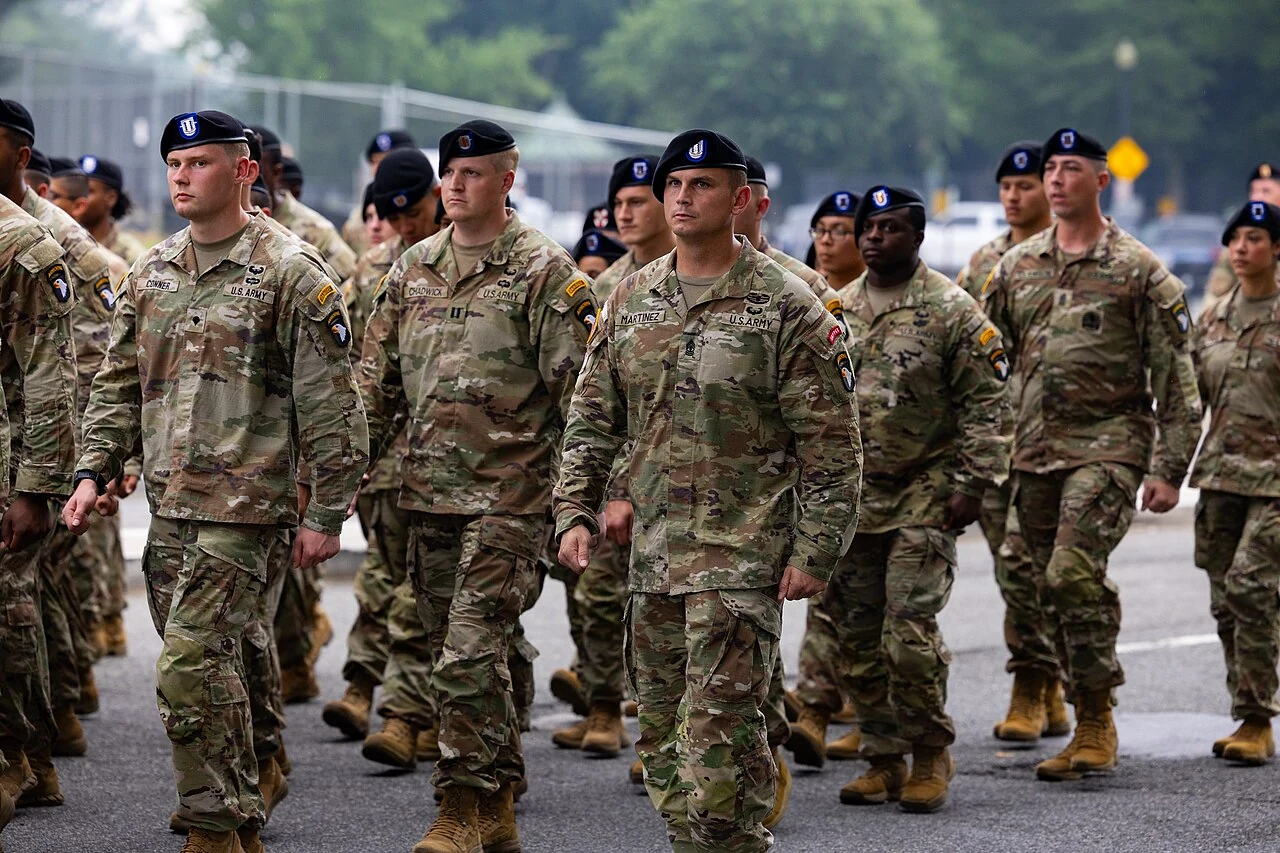
Average IQ by military branch: what the official data shows
No branch of the U.S. military publishes an average IQ, and the lists that claim one cannot be traced. What the Department of Defense does publish is the distribution of enlisted recruits across Armed Forces Qualification Test categories, service by service, next to a 1997 youth reference group. This page reads that official table for fiscal years 2022 and 2023, the quality benchmarks, the officer tests and the history behind them.
Army recruits were 45,974 of the 128,867 non-prior-service enlisted accessions in the Department of Defense total for fiscal year 2023, according to Table B-4 of the annual population report.
0 The short answer
No branch of the U.S. military publishes an average IQ, and the official record that does exist describes enlisted recruits by Armed Forces Qualification Test (AFQT) category, not by IQ. In fiscal year 2023, the Department of Defense's own table shows 79.81 percent of Air Force enlisted recruits and 52.10 percent of Army recruits at or above the 50th AFQT percentile, with the Marine Corps at 64.77 percent and the Navy at 54.39 percent, against 51.07 percent in the 1997 youth reference group. Those gaps reflect who applies to each service and which applicants each service accepts, so they describe groups of recruits in one year and cannot be converted into an IQ for a branch or for anyone who serves.
79.81 percent
Air Force non-prior-service enlisted recruits in AFQT Categories I to IIIA in fiscal year 2023, against 52.10 percent for the Army and 60.72 percent for the whole Department of Defense.
51.07 percent
The same measure for the 1997 civilian youth sample the AFQT is scored against, the only comparison group the official table prints.
10.54 percent
Share of all fiscal year 2023 recruits in Category IV, up from 2.58 percent in fiscal 2022, with 13,584 of the 13,585 such recruits in the Army and Navy.
No branch does: the Department of Defense publishes aptitude data for recruits as AFQT percentile categories and one overall mean percentile, and none of its tables reports an IQ. The source is an annual report called Population Representation in the Military Services, produced by the Office of People Analytics (OPA), with appendix tables for applicants, enlisted accessions, the enlisted force, officers and history. When this page was prepared on October 6, 2026, the newest edition listed on the OPA population representation page was fiscal year 2023, so this page uses fiscal years 2023 and 2022. The tables cover the active component of the five Department of Defense services, and they count non-prior-service enlisted accessions, which means recruits with no earlier military service. The reports carry Coast Guard information separately, and this page leaves it out.
Within the tables read for this page, the closest thing to an average is a single figure. Table B-46 of the fiscal year 2023 appendix gives the mean AFQT percentile of all non-prior-service enlisted accessions as 56.8, and it gives no mean for any single service. A percentile mean has a fixed reference point: a nationally representative youth sample scores about 50 by construction, so 56.8 says the 2023 recruits ranked, on average, about 7 percentile points above that sample. It does not say that their IQ averaged any particular number, and the section on conversion below explains why a mean percentile cannot be turned into one.
What the official sources do give by service is a distribution. Table B-4 reports, for each service, how many recruits fell into each AFQT category, and prints the 1997 civilian comparison beside them. That is a real, traceable, per-row source, and it is the evidence the rest of this page is built on. The sources also say what the scores are for. The OPA executive note on appropriate use of ASVAB scores lists three validated and approved uses: selection, classification and career exploration. It says the office does not endorse use of the scores for purposes other than those for which the test was designed. An average IQ for a service is not one of those three uses, so nothing in the office's own scheme calls for producing it.
The question has an everyday version, which is whether Marines, sailors, soldiers or airmen are on average smarter than civilians or than each other. The tables answer a narrower question about recruits in a given year, and the page on average IQ in the USA shows how national figures for a whole population are built, which is a different task from describing people who passed an entry screen.
2 What Does the AFQT Measure, and Against Whom Is a Recruit Ranked?
The AFQT is a composite of four Armed Services Vocational Aptitude Battery (ASVAB) subtests, reported as a percentile against a 1997 sample of American youth, so it ranks recruits against a fixed outside group and not against their own service. The OPA executive note describes the composite as built from Arithmetic Reasoning, Mathematics Knowledge, Paragraph Comprehension and Word Knowledge, reported as percentiles from 1 to 99 against a reference group of 18 to 23 year olds who took the ASVAB in a national norming study in 1997. A score of 50 means the examinee scored as well as or better than 50 percent of that sample. The population report groups the percentiles into six categories: Category I for 93 to 99, Category II for 65 to 92, Category IIIA for 50 to 64, Category IIIB for 31 to 49, Category IV for 10 to 30 and Category V for 1 to 9. The page on IQ versus the ASVAB covers the norming sample, the subtests and the conversion arithmetic in full, and this page does not repeat them.
In the vocabulary of the CHC model, the four AFQT subtests sample mainly acquired verbal knowledge (Gc) and quantitative knowledge and reasoning (Gq). They do not sample fluid reasoning (Gf), working memory (Gwm), visual spatial processing (Gv) or processing speed (Gs), which the other ASVAB subtests and a full IQ battery treat separately. The page on what IQ measures sets out how those domains combine into a single score and why a composite weighted toward two of them is not the same thing.
That does not make the AFQT unrelated to general ability. Ree and Earles studied 78,041 Air Force enlistees in 82 jobs and found that the first principal component of the ASVAB, which they treated as general ability, predicted job-training school grades and that the other components added little to the prediction. Frey and Detterman extracted measures of g from the ASVAB for 917 participants in the National Longitudinal Survey of Youth 1979 and reported a correlation of .82 with SAT scores, which they took as evidence that the SAT is mainly a test of g. Those findings support treating the battery as strongly g loaded. They concern the whole ASVAB, not the four-subtest AFQT, and they do not make a percentile on the AFQT an IQ. The page on the g factor explains the distinction.
The reference group matters for a second reason. A civilian aged 18 to 23 in 1997 was ranked against peers of that cohort, and a recruit today is ranked against that same fixed sample. The OPA note says the 1997 reference group and the 2004 norms are still representative of the current ASVAB population, based on recent evaluations, which is the office's own judgment, and the page on the Flynn effect explains why norm vintage is always worth checking. Two consequences follow for reading the tables. First, a service whose recruits sit above 50 percent in the upper categories is being compared with the whole youth population, including people who never applied. Second, because Category V is not enlistable without a waiver and Category IV is capped, the recruit distribution is truncated at the bottom by rule, so a recruit group would sit above the youth reference even if applicants were drawn at random from it.
3 How Do the Services Compare on Official AFQT Categories?
On the official fiscal year 2023 table, the Air Force recruited the highest share at or above AFQT 50 among the large services, followed by the Marine Corps, the Navy and the Army, and the same order held in fiscal year 2022. The table below reproduces the percent rows of Table B-4 for fiscal year 2023 and, for the second block, Table B-4 for fiscal year 2022. Each row covers non-prior-service active component enlisted accessions. The last column adds the three upper categories, and the 1997 civilian row is the comparison group printed in the same tables.
Fiscal year 2023
Recruits
Cat I
Cat II
Cat IIIA
Cat IIIB
Cat IV
Cat I to IIIA
Army
45,974
4.60
26.91
20.59
31.03
16.83
52.10
Navy
30,088
6.44
28.73
19.22
26.15
19.44
54.39
Marine Corps
28,591
3.84
34.20
26.73
35.23
0.00
64.77
Air Force
23,723
8.54
45.05
26.22
19.95
0.00
79.81
Space Force
491
26.88
62.12
9.16
0.61
0.00
98.17
All Department of Defense
128,867
5.67
32.43
22.62
28.66
10.54
60.72
1997 civilians, ages 18 to 23
21,107,689
7.86
27.66
15.54
18.78
20.75
51.07
Fiscal year 2022
Recruits
Cat I
Cat II
Cat IIIA
Cat IIIB
Cat IV
Cat I to IIIA
Army
40,431
5.55
31.10
23.07
35.29
4.89
59.72
Navy
33,217
7.69
34.78
22.61
30.85
3.97
65.09
Marine Corps
28,116
4.47
35.19
26.80
33.42
0.02
66.46
Air Force
25,923
9.17
46.40
25.97
17.76
0.02
81.53
Space Force
401
25.44
65.09
7.98
0.50
0.00
98.50
All Department of Defense
128,088
6.66
36.15
24.31
30.07
2.58
67.13
All cells are percent of each row's recruits, except the recruit counts. Rows do not add to 100 because a handful of recruits fall in Category V or have no recorded category, and because of rounding. In fiscal year 2023 the Air Force had one Category IV recruit and the Army had three Category V recruits. The civilian Category V share, 9.41 percent in the 1997 sample, is not shown in the column set, and it explains why the civilian row sums only to 90.59 across the columns shown.
Three readings follow directly from the figures. The first is that the order of the services at or above AFQT 50 did not change across the two years, with the Air Force highest among the large services and the Army lowest in both. The second is that the Marine Corps sits third, above the Navy and the Army, even though a widely read 2006 ranking examined later puts the Navy ahead of it. Its upper-category share comes from Categories II and IIIA, which together account for 60.93 percent of its fiscal year 2023 recruits, and from no Category IV recruits, while its Category I share, 3.84 percent, is the lowest of the large services. The third reading is that the top band is thin everywhere except the Air Force and Space Force. All Department of Defense recruits in fiscal 2023 had a Category I share of 5.67 percent against 7.86 percent for the civilian youth sample, so recruits as a group were more concentrated in Categories II and IIIA than the youth population was, and less concentrated at the very top and at the bottom.
The Space Force row needs the most care. A new service with 491 recruits in fiscal year 2023 and 401 in fiscal year 2022 is a few hundred people in a population of more than 128,000, and its 98.17 percent describes a small, specialized intake. The percentages in every row describe recruits who entered in a single fiscal year, not members who joined earlier, and they cannot say what the average of the whole force is.
4 Do the Differences Start Before Selection? Applicants Against Recruits
Most of the gap between services was already present among the people who applied to each one, so the recruit table reflects who comes forward as much as whom each service accepts. The same appendix reports applicants as well as recruits. Table A-4 counts non-prior-service people whose first formal application, meaning a screening physical or the ASVAB, came in fiscal year 2023, and it sorts them by the service they applied to. The applicant and recruit groups overlap but are not identical people, because some applicants never enlist and some enlist in a later year, so the comparison below is a comparison of two published rows and not a pass rate.
Fiscal year 2023
Applicants
Applicants, Cat I to IIIA (percent)
Recruits, Cat I to IIIA (percent)
Applicants, Cat IV (percent)
Recruits, Cat IV (percent)
Army
62,693
48.98
52.10
16.82
16.83
Navy
40,560
51.68
54.39
22.17
19.44
Marine Corps
35,528
60.91
64.77
6.11
0.00
Air Force
33,638
76.23
79.81
1.85
0.00
Space Force
378
98.41
98.17
0.00
0.00
All Department of Defense
172,797
57.48
60.72
12.92
10.54
1997 civilians, ages 18 to 23
21,107,689
51.07
not applicable
20.75
not applicable
Two patterns stand out. The order of the services is the same among applicants and among recruits, with the Air Force first and the Army last among the large services. The distance between the Air Force and the Army is 27.25 percentage points among applicants and 27.71 among recruits, which is our subtraction of the published rows. Whatever each service did at the acceptance stage, it did not create the distance between them, because the distance was already there when people filed their applications. The table does not explain why applicants sort across services this way, and the reasons people give for choosing a service, such as occupations offered, bonuses, location or family tradition, are outside the data.
Acceptance still matters in the one place the rules force it, which is the bottom category. Category IV was 16.82 percent of Army applicants and 16.83 percent of Army recruits, so the Army's recruit row looks like its applicant row in that cell. The Navy moved from 22.17 to 19.44 percent. The Marine Corps and the Air Force moved from 6.11 and 1.85 percent of applicants to no Category IV recruits at all, apart from one Air Force recruit. In other words, two services effectively screened Category IV out in fiscal year 2023, and two did not.
The applicant row also shows that people who enlist are not a random draw from the youth population before any service chooses among them. All Department of Defense applicants were 57.48 percent at or above AFQT 50 against 51.07 percent for the 1997 sample, and their Category I share was 5.31 percent, below the 7.86 percent of the reference sample. The OPA executive note warns about the general problem, saying that participation in ASVAB programs is generally voluntary and that comparing score distributions across self-selected subgroups is likely to give a distorted picture of true differences. That caution was written about schools and states, and the same logic applies to services: a service table is a table of whoever chose that service and was accepted.
The tables also split recruits by sex and by race and ethnicity within each service, so the mix of people entering differs from one service to another, and a difference between two totals can come from mix as much as from anything else. The page on average IQ by gender covers the group comparison between men and women on its own terms, and the military tables do not support reading any such split as a statement about ability.
5 What Changed in Fiscal Year 2023? Category IV, the Statute and an Inspector General Review
Almost all of the Category IV recruits in fiscal year 2023 entered the Army and the Navy, and the rise from 2.58 percent to 10.54 percent of the Department of Defense total is the largest single movement in the recent record. Counted from Table B-4, the Army took 7,736 Category IV recruits, 16.83 percent of its 45,974, and the Navy took 5,848, 19.44 percent of its 30,088. The Department total was 13,585, so 13,584 of them were in those two services. In fiscal 2022 the Department total was 3,304, or 2.58 percent. Table D-8 reports the share by year since 1973, and no year from fiscal 1984 through fiscal 2022 reaches the fiscal 2023 figure.
Two legal and policy reference points frame the number. The first is the statute. Under 10 U.S.C. 520 as it now reads, the number of people enlisted into an armed force in a fiscal year whose AFQT score is at or above the tenth percentile and below the thirty-first may not exceed 4 percent of that force's enlistments, and the Secretary of Defense may authorize an increase to not more than 20 percent on the request of the service secretary, with notice to the armed services committees within 30 days. The Public Law that made this change, Public Law 118-31, was enacted on December 22, 2023, after fiscal year 2023 ended, and the notes on the statute record that it substituted 4 percent for the earlier 20 percent. That means the Army's and Navy's 2023 shares were at or under the ceiling that applied during that fiscal year, and they are well above the figure that applies now. The second reference point is departmental policy. The OPA executive note says the benchmark in Department of Defense Instruction 1145.01 is that 60 percent of a fiscal year's accessions score at or above the 50th percentile, and that no more than 4 percent of an accession cohort may be in Category IV. In fiscal 2023 the Army's 52.10 percent and the Navy's 54.39 percent were below 60, which is our comparison of two published numbers and not a finding of compliance or non-compliance.
The Army's own recruiting page explains one route into the Category IV band. The GoArmy ASVAB page, read on October 6, 2026, says the Army requires a score of at least 31 to enlist and describes an academic track of the Future Soldier Preparatory Course for applicants with a minimum score of 21. The Department of Defense Inspector General examined that course in a management advisory dated May 1, 2025, report DODIG-2025-092. It says the Assistant Secretary of the Army for Manpower and Reserve Affairs authorized the course in July 2022 to help applicants qualify academically and physically in a challenging recruiting environment, and that its academic component takes applicants in Categories IVA and IVB for up to 90 days of instruction in arithmetic reasoning, reading comprehension and word knowledge, with retests on the Armed Forces Classification Test.
The advisory's findings concern how scores earned after enlistment are counted. It states that the Army used retest scores to reclassify trainees from Category IV to Category III or higher, that this contradicts the statute's wording that the score counted is the one at the time a person is originally enlisted, and that, in its determination, the Army Active Component exceeded category IV enlistments by over 10 percent because of that reclassification. The advisory also records that one of its recommendations was considered resolved and four unresolved at the time of issue, and that management comments did not address the specifics of one of them. This page takes no position on the dispute. It uses the advisory for two things only: the published rule about which score counts, and the fact that Category IV is the cell in the fiscal 2023 table with the most documented discussion. The table notes for B-4 do not say how preparatory course retests are counted in the Army row, and this page does not infer it.
None of the sources explains why the Navy's Category IV share rose, and the advisory does not review the Navy. A rise of this size is a fact about recruiting, entry policy and the applicant pool in that year, not about the intelligence of anyone who serves.
6 What Do Education and the High Quality Benchmark Add?
The Department of Defense defines a high quality recruit as a high school diploma graduate in AFQT Categories I to IIIA, and by that stricter definition the share fell in every service that existed in both fiscal 2011 and fiscal 2023. The definition appears in the notes to Table B-8: accessions with AFQT scores in Categories I to IIIA and Tier 1 educational backgrounds. The notes to Table B-6 say Tier 1 is primarily high school diploma graduates, together with some who have more education or adult education diplomas, Tier 2 is alternate credentials such as the GED, and Tier 3 is non-graduates. The fiscal 2023 Tier 1 shares were 91.47 percent in the Army, 95.13 in the Navy, 95.22 in the Marine Corps, 96.34 in the Air Force, 97.76 in the Space Force and 94.08 for the Department. The civilian comparison in the same table combines Tiers 1 and 2 for 18 to 24 year olds and reports 86.86 percent.
Service
Tier 1 share, FY2023
High quality, FY2011
High quality, FY2018
High quality, FY2021
High quality, FY2022
High quality, FY2023
Army
91.47
60.55
59.98
56.98
54.66
47.32
Navy
95.13
87.42
73.14
64.59
61.56
51.51
Marine Corps
95.22
73.29
70.19
66.38
63.82
61.66
Air Force
96.34
96.97
80.81
78.85
78.73
76.79
Space Force
97.76
not applicable
not applicable
not applicable
96.76
95.93
All Department of Defense
94.08
75.58
68.87
64.89
63.46
57.09
The high quality columns come from Table D-9, and every value is a percent of that service's recruits in the fiscal year. Table D-9 also carries a footnote that some of its values reflect the ASVAB misnorming discussed in the next section, which is another reason to read the long series with caution. The series makes three points. High quality shares fell in every service that existed in both years. The order in fiscal 2023, Air Force, Marine Corps, Navy, Army, matches the AFQT order, but it was not always so, because the Navy ranked second in 2011 and 2018 and third from 2021. And the gaps are not stable: the Navy was at 87.42 percent in 2011 and 51.51 percent in 2023, a drop of nearly 36 points, while the Marine Corps moved from 73.29 to 61.66.
Education is a second route by which services differ without any difference in aptitude scores being implied. A Tier 1 credential reflects schooling completed, and the share holding one differs by about 5 points between the Army and the Air Force in 2023. Because high quality combines two conditions, a service can fall short on either one, and the table does not show which. The page on average IQ by education covers what the research shows about educational attainment and measured ability, and nothing in these tables can separate the two.
The benchmarks matter for another reason: they are published targets, so an AFQT distribution is partly the result of a policy goal and of how many recruits a service needed in a given year. The tables do not say whether the people who were not recruited would have scored higher or lower than the people who were.
7 How Have Quality Limits Moved Since World War II?
The Department of Defense has moved its entry floor and its scoring scale repeatedly since World War II, and in one episode, from 1976 to 1980, a scaling error let in a much larger share of low scorers than the services believed. The most thorough official history is Milton Maier's 1993 report for the Defense Manpower Data Center, Military Aptitude Testing: The Past Fifty Years, whose archived text we used. It says the military testing program began with the Army General Classification Test and the Navy General Classification Test of World War II, that the Army test was taken by more than nine million recruits, and that the Army test scale had a mean of 100 and a standard deviation of 20. That last fact is worth pausing on. A wartime score of 100 on that scale was not an IQ of 100 on the modern scale with a standard deviation of 15, and a military number that looks like an IQ often has a different unit. The page on the standard deviation of 15 explains why the unit matters.
The same report documents the movement of the floor. The minimum AFQT for inductees in 1950 was set at 13, and in July 1951 the minimum for induction during mobilization was lowered to 10. Congress authorized supplementary testing of people in what is now Category IV in 1958. Effective October 1, 1966, the Secretary of Defense initiated Project 100,000, whose stated objectives included giving previously ineligible men an opportunity to serve if they met new standards. That same month mental standards for induction were revised to require an AFQT of 31 or higher in general, while allowing 16 to 30 for high school graduates and 10 to 30 with two aptitude area scores of at least 90 for non-graduates. The report describes the all-volunteer era that followed, and says the quality of recruits in the 1980s reached an all-time high on mean aptitude and percentage of high school graduates.
The 1976 to 1980 episode is the sharpest lesson. The ASVAB was introduced for testing all applicants on January 1, 1976, after a development effort the report says took less than two years, and Maier writes that scaling shortcuts and clerical errors inflated scores. The error lingered for close to five years, was documented in 1980, and was fixed in October 1980 when new forms were introduced. He reports that over 400,000 recruits, about 30 percent of the total, entered in that period in what is Category IV on the accurate scale, that in 1980 the Army thought only 10 percent of its recruits were in Category IV and reported that figure to Congress when on the correct scale over 50 percent were, and that over 350,000 recruits would not have been eligible under the standards then in force had the scale been correct. He cites Laurence and Ramsberger and Eitelberg, Laurence and Waters for the last two figures.
The official table shows the swings. Its footnote says its values reflect the ASVAB misnorming, without saying which rows, so it is a series of printed shares and not a clean history of recruit ability. The statute followed in the same period: 10 U.S.C. 520 was added on September 8, 1980, and its notes record caps of 25 percent for the fiscal years beginning October 1, 1980 and October 1, 1981, a 20 percent cap in later years until 2023, and the 4 percent rule with a Secretary of Defense exception that applies now. The sources do not say the error caused the statute, and this page does not claim it did.
Fiscal year
Category IV share of all Department of Defense recruits (percent)
Note
1973
12.70
Table begins
1976
4.95
ASVAB introduced January 1, 1976
1977
27.10
Table footnote: five quarters
1979
32.74
Highest share in the table
1980
8.70
Last fiscal year before the October 1980 fix
1981
21.26
First fiscal year with the new forms
1983
10.69
1992
0.19
Lowest share in the table through 2010
2022
2.58
2023
10.54
Army 16.83, Navy 19.44, others about 0
Source: Table D-8, with the Table B-4 service split for fiscal 2023. The lesson for anyone reading a modern branch comparison is that the scale, the floor and the way of counting have all been revised, so a figure from one period cannot be set beside a figure from another without checking what each number meant. The current reference scale, the 1997 youth sample, replaced the 1980 scale, which the population report says replaced the World War II scale, and each replacement moved the meaning of a given percentile.
8 What Do Officers and Aviators Take Instead?
The population report publishes officers by education and source of commission, not by AFQT, so there is no officer table comparable to the recruit table, and each service uses its own tests for particular programs.Table B-26 reports officer gains in fiscal year 2023 by service and degree, and the 16,313 gains in the Department total were 8.10 percent with less than a four year degree, 57.57 percent with a four year degree, 5.91 percent with more than a four year degree and 28.43 percent with the education recorded as unknown. That unknown share is large, and in the Army it is 38.32 percent, which limits what any comparison of officer corps by degree can show. Table B-30 gives the source of commission for the same gains, with 16.42 percent from service academies, 10.70 percent from scholarship ROTC, 12.99 percent from non-scholarship ROTC, 11.86 percent from officer candidate and training schools, 13.74 percent by direct appointment and 33.47 percent unknown.
Fiscal year 2023 officer gains
Gains
Under 4 year degree (percent)
4 year degree (percent)
Over 4 year degree (percent)
Unknown (percent)
Army
5,734
12.85
43.55
5.28
38.32
Navy
3,729
0.13
71.01
3.27
25.58
Marine Corps
1,660
27.17
70.48
2.17
0.18
Air Force
4,737
2.58
59.19
9.12
29.11
Space Force
453
1.32
60.04
15.67
22.96
All Department of Defense
16,313
8.10
57.57
5.91
28.43
Officer selection uses program specific tests. The Air Force Officer Qualifying Test is described in the Air Force's AFOQT information pamphlet as measuring aptitudes used to select candidates for officer commissioning programs and specific officer training programs, with 12 subtests combined into five composites named Pilot, Navigator-Technical, Academic Aptitude, Verbal and Quantitative. The Aviation Selection Test Battery is described in a Marine Corps officer selection overview as one criterion used by the Navy, Marine Corps and Coast Guard for officer aviation applicants, with portions used by the Navy for officer candidate school and a score scaled from 20 to 80. That overview describes forms introduced in 2004, so current forms and limits should be checked with the service. Neither test is an IQ test, and neither publishes a service average.
The one published officer series found for this page is outside the population report. In 2015 the Brookings Institution reported research by Klein and Cancian using General Classification Test scores of 46,000 Marine Corps officers from fiscal 1980 to fiscal 2014, obtained through a Freedom of Information Act request. It reports an average that fell from 130.9 to 122.1 and says the test was designed with a mean of 100 and a standard deviation of 20. Those numbers are on a service screening scale with a standard deviation of 20, so a score of 130.9 is not an IQ of 130.9. The data cover one service only, and the article says its findings are for the Marine Corps. It is a trend in one test for one officer corps, not a ranking of services.
9 Where Do Circulating "IQ by Branch" Lists Come From?
The circulating lists trace to unsourced ranking pages, a single blog conversion of one 1998 figure, and minimum score tables that official recruiting pages do not confirm. The table sets each recurring claim beside what could be opened and traced on October 6, 2026.
It gives no numbers and cites no source, and it says the Pentagon does not release an IQ report card. The fiscal 2023 table is consistent with the top places but says nothing about IQ
New enlistees average an IQ of about 105, with the Navy slightly ahead of the Army and Marines
His own estimate for 1998 recruits, citing a Department of Defense table, with no per service numbers. The scale was the 1980 youth norm, and in fiscal 2023 the Marine Corps is third, ahead of the Navy and Army
Minimum scores of 36 for the Air Force, 35 for the Navy, 32 for the Marine Corps, 31 for the Army
Pages returned by a search on this topic
No official source found. The Army, Marine Corps and Air Force pages read on October 6, 2026 each state 31 for high school graduates, and the Air Force page states 50 for GED holders
The official ASVAB eligibility page says only that the minimum AFQT score varies across the branches and points readers to recruiters. The Navy's own page could not be opened, so no Navy minimum is stated here. Minimums also change with policy, and the Army's page now describes a lower entry route through its preparatory course, which a fixed list cannot show.
The DesperateMinds page says that lists circulating online usually convert old military aptitude scores or small selective samples into IQ-like numbers. That matches the pattern in the table: a percentile cutoff, which is a rank against a youth sample, is restated on the IQ scale and then attached to a service as if it were an average, although a minimum is a floor and an average is something else. The restatement is arithmetic that can be correct for one percentile, and the page on IQ and the ASVAB publishes it. The error is in the step from a floor on a percentile scale to an average for a branch.
10 Can a Branch Table Be Converted Into an Average IQ?
No: a distribution of AFQT categories cannot be turned into one defensible IQ for a branch, because the conversion depends on assumptions the published tables cannot verify, and this page therefore publishes no per branch IQ. The arithmetic itself is simple and is shown as an approximation. An AFQT percentile can be restated on the IQ scale by finding the z score for that percentile on a normal curve, multiplying by 15 and adding 100. The assumptions are that the percentile is a rank in the 1997 youth sample, that the ability being ranked is distributed normally, and that rank on the AFQT equals rank on an IQ battery. The last assumption is the weak one, because the AFQT samples verbal and quantitative knowledge and omits other domains, and no figure for how far an AFQT rank departs from an IQ battery rank is used on this page.
The next problem is averaging. Percentiles are ranks, and a mean of ranks is not a rank of means. The illustration is our arithmetic, not a finding from any source. Suppose group A scores at exactly the 60th percentile, which is 103.8 on the IQ scale by the formula. Suppose group B has half its members at the 20th percentile, 87.4, and half at the 99th percentile, 134.9. The mean percentile of group B is 59.5, almost the same as group A's 60, yet the mean of the IQ restated values is 111.1, more than 7 points higher. The page on IQ score versus percentile explains the problem in general. The category table lets a reader count shares, and it does not let anyone recover where inside each category the recruits fell, which is exactly what an average would need.
Two further limits apply. The recruits are a truncated group, since the Department sets a floor and a cap, so an average over them describes who was accepted. And the services differ in applicants, mix and policy, as the earlier sections showed. For a reader who wants to place a single AFQT percentile on the IQ scale, the IQ percentile calculator and the rarity calculator do that for one number, with the caveats above. They do not produce a number for a service.
11 What the Evidence Supports, Stated Narrowly
The evidence supports statements about the distribution of AFQT categories among enlisted recruits in specific fiscal years, and nothing about the intelligence of a branch or of its members. Each statement below carries its source.
In fiscal 2023, 79.81 percent of Air Force, 64.77 percent of Marine Corps, 54.39 percent of Navy and 52.10 percent of Army non-prior-service enlisted recruits were in AFQT Categories I to IIIA, against 60.72 percent for the Department of Defense and 51.07 percent for the 1997 civilian sample (Table B-4).
The same order among the large services held in fiscal 2022 and among fiscal 2023 applicants (Table B-4 for 2022, Table A-4).
Category IV was 10.54 percent of fiscal 2023 recruits, almost all in the Army and Navy, against 2.58 percent a year earlier.
The high quality share, which adds a diploma-level credential, fell in every service that existed in 2011 and 2023 (Table D-9).
The only mean the tables give is a Department wide mean AFQT percentile of 56.8 for fiscal 2023 recruits (Table B-46), which is a rank statement and not an IQ.
The evidence does not support ranking the branches by intelligence, treating service differences as differences in people's ability, using a branch figure to predict anything about one person, or comparing a fiscal 2023 row with an old list on a different scale. It also does not tell us why applicants differ across services or why Category IV shares moved.
12 What This Does Not Say About Any Service Member, or About You
A published table of recruit categories says nothing about the cognitive ability of any one person who serves, served or is thinking of serving, and it does not say what your own score would be. The Standards for Educational and Psychological Testing (AERA, APA and NCME, 2014) treat validity as the degree to which evidence and theory support the interpretation of test scores for a proposed use, a definition the Office of People Analytics itself quotes when it warns against uses beyond selection, classification and career exploration. A group row from a population report supports statements about the group in the year counted. It was not built to support a statement about a person, and the Office of People Analytics adds that each new proposed use must undergo its own validation.
The American Psychological Association's Ethical Principles of Psychologists and Code of Conduct, Standard 9.06, asks psychologists to take the purpose of an assessment and the characteristics of the person assessed into account and to state the significant limitations of their interpretations. A branch average, even a sourced one, ignores the person, the purpose and the limits all at once. Reading a score responsibly means keeping its reference group, its scale, its interval and its purpose in view, which the page on what an IQ score means describes for scores in general.
For a reader, three practical points follow. An AFQT percentile is a rank against a 1997 youth sample and was built to decide eligibility and job assignment, so it stays within that use. A person who wants a measure of their own cognitive profile needs an instrument designed for that purpose, with a reference group of adults, a report that shows the scale, and an interval around the number. ACIS is one online option, with the limits stated on its pages: it is online and unsupervised, it is not a clinical or diagnostic instrument, it is not for hiring, school accommodations or admission to high IQ societies, and it is offered in English only. Its technical manual documents the instrument, and the choice among online tests is covered on the page for the best online IQ tests.
Finally, no branch comparison here should be read as a verdict on a branch, on the people in it, or on service as a choice. The tables describe an entry screen and the people who came forward in a year. Many valuable skills for military work, such as judgment under stress, technical training, leadership and reliability, are not what an AFQT percentile measures, and this page makes no claim about them.
13 Sources Behind This Page
Every figure on this page comes from an official table or report opened on October 6, 2026, or from a published paper, and the pages examined as circulating claims are listed as claims, not as evidence. Population report tables are quoted as printed, and sums or differences between printed rows are marked as our arithmetic in the text. Dates are the dates read.
Office of People Analytics. Population Representation in the Military Services: Fiscal Year 2023 Summary Report, Appendix B, Tables B-4, B-6, B-8, B-26, B-30 and B-46, 2023.
Office of People Analytics. Population Representation in the Military Services: Fiscal Year 2023 Summary Report, Appendix D, Tables D-8 and D-9, historical data 1973 to 2023.
Office of People Analytics. Population Representation in the Military Services: Fiscal Year 2022 Summary Report, Appendix B, Table B-4, 2022.
No official average IQ for the military exists, because the Department of Defense publishes AFQT percentile categories instead. Fiscal 2023 recruits had a mean AFQT percentile of 56.8, against about 50 for the 1997 youth reference sample. That ranks one year's recruits against a fixed group, and it is not an IQ.
Which military branch has the highest average IQ?
No branch publishes an IQ. On the official fiscal 2023 table, the Air Force had the highest share of recruits at or above AFQT 50 among the large services, 79.81 percent, followed by the Marine Corps at 64.77, the Navy at 54.39 and the Army at 52.10. The Space Force was higher but very small.
Which military branch has the lowest IQ?
No source ranks branches by lowest IQ. In fiscal 2023 the Army had the smallest share of recruits at or above AFQT 50 among the large services, 52.10 percent, close to the 51.07 percent of the 1997 youth sample. That describes one year's entry cohort and says nothing about any individual.
What is the average IQ of the Air Force?
The Air Force publishes no average IQ. Its fiscal 2023 recruits were 79.81 percent in AFQT Categories I to IIIA and 8.54 percent in Category I, the highest large-service shares in that table. These are percentile categories against 1997 youth, and they cannot be converted into one IQ number for the service.
What is the average IQ of Marines?
The Marine Corps publishes none. In fiscal 2023 its recruits were 64.77 percent in Categories I to IIIA with no Category IV recruits, which placed it third among services. Its Category I share, 3.84 percent, was the lowest of the large services, so category shares and averages can tell different stories.
What is the average IQ of the Army and Navy?
Neither publishes an IQ. In fiscal 2023 the Army had 52.10 percent and the Navy 54.39 percent of recruits in Categories I to IIIA, and both took Category IV recruits, at 16.83 and 19.44 percent. Those figures describe entry cohorts, and no source supports an average for either force.
What IQ do you need to join the military?
No IQ is required, because the services screen on the AFQT percentile. The Army, Marine Corps and Air Force pages read on October 6, 2026 state a minimum of 31 for high school graduates, and the Army describes a preparatory course for applicants at 21. An AFQT percentile is not an IQ.
What does the Department of Defense publish about recruit aptitude by service?
The Office of People Analytics publishes the annual Population Representation in the Military Services report. Its tables give recruit counts and percentages by AFQT category for each service, applicants, education tiers, high quality shares, a civilian comparison and history since 1973. The tables read for this page give no IQ and no mean by service.
What is the AFQT?
The Armed Forces Qualification Test is a composite of four ASVAB subtests: Arithmetic Reasoning, Mathematics Knowledge, Paragraph Comprehension and Word Knowledge. It is reported as a percentile from 1 to 99 against a 1997 sample of 18 to 23 year olds and is used to decide enlistment eligibility. It is not an IQ test.
What are AFQT Categories I to IIIA?
They are the percentile bands from 50 to 99: Category I for 93 to 99, Category II for 65 to 92 and Category IIIA for 50 to 64. The Department reports their combined share of recruits as a quality measure, with a policy benchmark of 60 percent of a year's accessions.
How many Category IV recruits entered in fiscal 2023?
The Department of Defense counted 13,585 Category IV recruits, 10.54 percent of 128,867, up from 3,304 or 2.58 percent of 128,088 in fiscal 2022. The Army took 7,736 and the Navy 5,848. The Marine Corps took none and the Air Force one.
What is a high quality recruit?
The Department defines a high quality recruit as a person in AFQT Categories I to IIIA with a Tier 1 education, primarily a high school diploma. In fiscal 2023 that was 57.09 percent of all recruits: 47.32 in the Army, 51.51 in the Navy, 61.66 in the Marines and 76.79 in the Air Force.
Do applicants differ by service before selection?
Yes. Among fiscal 2023 applicants, 76.23 percent of Air Force and 48.98 percent of Army applicants were in Categories I to IIIA, a gap of 27.25 points, and the gap among recruits was 27.71. Most of the distance between services was already present before acceptance, though the groups are not identical people.
What was the ASVAB miscalibration of 1976 to 1980?
A scaling error inflated ASVAB scores from 1976 until new forms arrived in October 1980. A Defense Manpower Data Center history reports over 400,000 recruits, about 30 percent, in Category IV on the accurate scale, and says the Army believed 10 percent of its 1980 recruits were there when over 50 percent were.
Is the AFQT an IQ test?
No. The AFQT ranks examinees against a 1997 youth sample using four verbal and quantitative subtests, and it was designed for enlistment eligibility. Research finds the whole ASVAB strongly g loaded, but a percentile is a rank and not a deviation IQ, and a full battery samples more domains.
Can I convert branch category shares into an average IQ?
Not defensibly. Category shares do not show where inside each band recruits scored, and a mean of percentiles is not a rank of means. In an illustration, two groups with mean percentiles near 60 map to IQ equivalents of 103.8 and 111.1. This page publishes no branch IQ.
Do officers have higher IQs than enlisted personnel?
No source in the tables answers it. Officers are reported by degree and source of commission, not AFQT, and many are recorded with education unknown. Degree holders were at least 63.48 percent of fiscal 2023 officer gains by our sum, but a degree is not an IQ, and officer tests use different scales.
Are military recruits smarter than civilians?
On the AFQT, recruits ranked above the 1997 youth sample, with 60.72 percent in Categories I to IIIA against 51.07 percent. That is partly by rule, since Category V is barred without a waiver and Category IV is capped, so it shows a screened entry group and not that people who serve are generally smarter.
Why is the Space Force so high?
Its fiscal 2023 recruits were 98.17 percent in Categories I to IIIA, but there were only 491 of them, and the service is new and specialized. A small intake makes the share unstable, and it should not be compared directly with the Army's 45,974 recruits.
How is the AFQT different from an ACIS result?
The AFQT gives one percentile against a 1997 youth sample for enlistment decisions. ACIS reports a Full Scale IQ and six index scores against adult norms for ages 16 to 90, with percentiles and a 95 percent confidence interval. ACIS is online and unsupervised and is not a military or clinical instrument.
How should I read a headline that says one branch is smartest?
Check four things: whether the figure is an IQ or an AFQT share, which fiscal year it covers, which group it describes, and which table it cites. A headline with no table, year or reference group cannot be traced, and an AFQT share is a rank statement about entry cohorts.
Take the assessment
You get a profile, not a number
ACIS measures six CHC domains across 20 subtests and reports each one with its own normed score and confidence interval, so you can see where you are strong and where you are not.