IQ Score vs Percentile The Same Fact in Two Languages
A score of 130 and a percentile of 97.7 say exactly the same thing. But five points near the average moves you ten times further through the population than five points near the top, and almost nobody reading a report knows that.
0 Quick Answer
Updated August 16, 2026 by Structural. An IQ score and a percentile rank are two ways of expressing the same position in a distribution. The score states how many standard deviations you are from the mean. The percentile states what share of the reference sample scored at or below you.
Direct answer: the conversion is fixed, because IQ scores are defined by the normal distribution. A score of 100 is the 50th percentile. A score of 115 is the 84th. A score of 130 is the 98th. Nothing about the test changes these numbers, because they are properties of the scale rather than findings about the instrument.
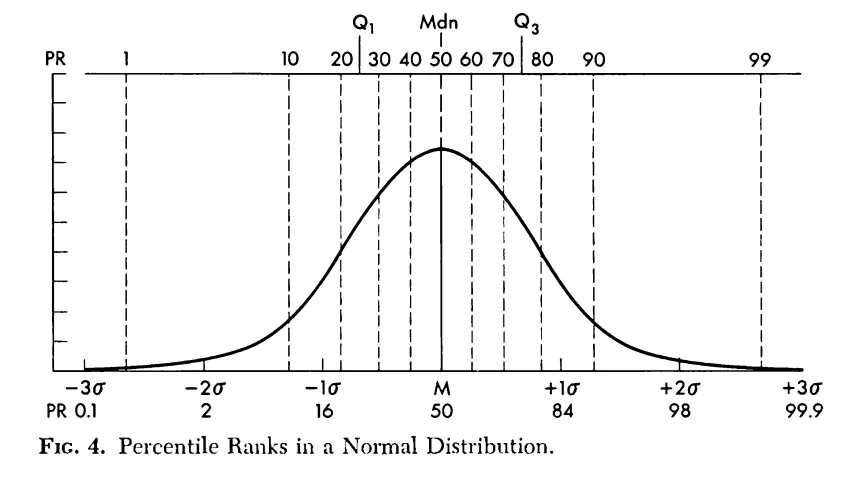
The crucial and widely missed point is that the relationship is not linear. Moving from 100 to 105 takes you from the 50th percentile to roughly the 63rd, a jump of thirteen points of population. Moving from 130 to 135 takes you from about the 98th to the 99th, a jump of barely one. The same five points mean very different things depending on where you start.
An IQ score is a standard score, which means it was constructed rather than measured. Understanding how it was constructed removes most of the mystery about what it can and cannot tell you.
The process starts with a raw score, which is simply how many items you got right, weighted by whatever partial credit the scoring rules allow. A raw score is not comparable to anything. Forty-two correct answers is meaningless without knowing how hard the items were, how many there were, and how everybody else did.
The raw score is then compared against a reference sample of people the same age, and expressed in terms of how far it sits from that sample's average, measured in standard deviations. That figure gets rescaled to a convention where the mean is 100 and one standard deviation is 15 points. Two further conversions sit inside that sentence, the age band lookup and the summing of scaled scores before the rescaling happens, and the nine steps that run from credit on one item to a confidence interval are set out in the chain a test uses to turn one answer into a reported index.
So a score of 115 means one standard deviation above the reference sample mean. A score of 85 means one below. A score of 130 means two above. The numbers 100 and 15 carry no meaning beyond convention: the same information could have been reported with a mean of 0 and a standard deviation of 1, and in the research literature it frequently is.
Two consequences follow immediately. First, an IQ score is inherently comparative, and there is no such thing as an absolute cognitive quantity it measures. Second, the score depends entirely on which reference sample was used, which is why the same performance produces different scores against different norms and why the provenance of the norms matters more than almost anything else about a test.
2 What a Percentile Rank Actually Is
A percentile rank states the percentage of the reference sample scoring at or below a given point. If you are at the 84th percentile, then 84 percent of the comparison group scored the same or lower.
The advantage of percentiles is that they need no explanation. Everybody understands what being ahead of 84 percent of people means. Standard deviations require a statistics lesson, which is why reports intended for non-specialists lead with percentiles and why professional reporting standards encourage including them.
There are two traps worth naming immediately.
The first is confusing percentile rank with percentage correct. They are unrelated. Somebody at the 90th percentile did not answer 90 percent of items correctly, and might have answered a third of them correctly if the test was hard. Percentile is a position among people. Percentage correct is a proportion of items. The similarity of the words causes real confusion in reports that do not label them carefully.
The second is forgetting the reference group. A percentile is always relative to a specific sample, and moving the sample moves the percentile without anything about the person changing. The 90th percentile among a general population sample and the 90th percentile among a sample of doctoral students are very different levels of performance. A percentile with no stated reference group is not interpretable, and this is the mechanism behind most of the inflated scores that circulate from unnormed online tests. The clearest case involves an instrument nobody calls junk, because the ICAR pool was built for research and never published norms, so every ICAR percentile on every site that reports one was manufactured rather than derived.
3 The Conversion Table
Because IQ scores are defined against the normal distribution, the conversion is fixed and can be tabulated once. These values are properties of the scale, not measurements from any particular instrument.
IQ score
Standard deviations from mean
Percentile rank
Roughly one person in
70
2.00 below
2.3
44 below this point
75
1.67 below
4.8
21 below this point
85
1.00 below
15.9
6 below this point
90
0.67 below
25.2
4 below this point
100
at the mean
50.0
2 above or below
110
0.67 above
74.8
4 above this point
115
1.00 above
84.1
6 above this point
120
1.33 above
90.9
11 above this point
125
1.67 above
95.2
21 above this point
130
2.00 above
97.7
44 above this point
135
2.33 above
99.0
100 above this point
140
2.67 above
99.6
261 above this point
145
3.00 above
99.87
741 above this point
160
4.00 above
99.997
31,560 above this point
The table is symmetric around 100, so the percentile for a score below the mean is one hundred minus the percentile of the equally distant score above it. A score of 85 sits at 15.9, mirroring 115 at 84.1. That symmetry is a property of the normal curve rather than an empirical claim, and section 7 explains where it stops holding.
The final column is where the scale stops being intuitive. Going from 130 to 145 changes the percentile by barely two points, from 97.7 to 99.87, which sounds like almost nothing. In terms of rarity it changes the frequency from one person in forty-four to one in seven hundred and forty-one, a factor of nearly seventeen. Percentiles compress at the extremes in a way that hides how much is happening there.
4 Why the Relationship Is Not Linear
The reason for all of this is the shape of the normal distribution. Most people are bunched near the middle and the density thins out rapidly toward the edges, so a fixed step along the score axis crosses very different numbers of people depending on where it starts.
Near the mean, the distribution is at its densest. A five point step from 100 to 105 crosses about thirteen percent of the population, because that is where almost everybody is.
At two standard deviations, the distribution has thinned dramatically. The same five point step from 130 to 135 crosses barely one percent, because there are hardly any people left to cross.
At three standard deviations there are almost none. The step from 145 to 150 crosses about a tenth of a percent.
This has a practical implication people find counterintuitive. If your score rises by five points, how much that matters depends entirely on where you started. Moving from 95 to 100 changes your position relative to a large number of people. Moving from 140 to 145 barely changes it at all in percentile terms, even though in rarity terms it is a much bigger change. Neither framing is wrong, and reports that give one without the other are giving you half the picture.
It also explains why gains reported in cognitive training studies look different depending on which scale is used. A gain expressed in percentile points sounds impressive if the sample started near the mean and unimpressive if it started high, for reasons that have nothing to do with the training. This is one reason the research literature reports effects in standard deviation units rather than percentiles, a point developed in Can You Improve Your IQ?.
5 Percentiles Are Not an Interval Scale
This follows from the previous section and is the most consequential technical point on the page, because it invalidates a whole category of things people do with percentile numbers.
An interval scale has equal distances between equal numeric differences. Temperature in Celsius is one: the gap between 10 and 20 degrees is the same amount of heat as the gap between 30 and 40. Standard scores are approximately interval, which is why averaging them and computing differences between them is legitimate.
Percentiles are not. The gap between the 50th and 60th percentile is about four IQ points. The gap between the 89th and the 99th, also ten percentile points, is about eighteen IQ points. The same numeric difference represents wildly different amounts of the underlying ability.
Three things follow, and all three are routinely violated.
You cannot average percentiles. Someone at the 50th on one index and the 90th on another is not at the 70th overall. To combine, you convert to standard scores, average those, and convert back, which produces a different and correct answer.
You cannot subtract percentiles to express a difference. A ten point percentile gap near the middle and a ten point gap near the top are not comparable quantities, so the subtraction produces a number with no consistent meaning.
You cannot compute a rate of change in percentiles across time or conditions. The same underlying improvement produces a larger percentile movement for somebody starting near the mean, so any comparison of percentile change across people at different starting points is confounded by starting point alone.
The practical rule is simple: use percentiles to communicate a single position to a person, and use standard scores for every calculation. This is why professional reports show both, and why the arithmetic in them is always done on the standard score side.
6 The Confidence Interval Nobody Quotes
Both scales share a limitation that gets omitted far more often than it should: neither is exact, because no test measures without error. Reporting that error honestly is part of the reliability that an accurate score depends on, which is why a serious report prints a confidence band around every index rather than a single digit.
Every score carries a standard error of measurement, derived from the test's reliability. For a well constructed full scale score the ninety-five percent confidence interval is typically around plus or minus four to five points. That means a reported score of 118 is properly read as a range from about 113 to 123, and the true value could be anywhere inside it.
A percentile expresses position, while an IQ level or descriptor groups scores using a manual's chosen boundaries and wording.
Translated into percentiles, a score of 118 sits at the 88th, but the interval spans roughly the 81st to the 94th. That is a substantial range, and it disappears completely when a report states a single number.
The Standards for Educational and Psychological Testing require that test users be given the information needed to interpret scores, including the standard error, and clinical reporting conventions treat the confidence interval as part of the score rather than an optional addition. Sample reports from major publishers show every index with its interval attached for exactly this reason.
Two practical consequences follow. A difference of a few points between two testings is not a change, it is measurement noise, and treating it as improvement or decline is reading error as signal. And a threshold applied to a single point value, such as a cutoff for a selection decision, discards the fact that somebody two points below it may well be above it in reality. Any use of a score at a boundary should account for the interval rather than pretending it does not exist.
7 Why the Tails Break Down
Everything above assumes the normal distribution holds. Near the mean it holds very well. At the extremes it holds much less well, and claims made about extreme scores are considerably weaker than their precision suggests.
The first problem is norming. Standardisation samples typically contain a couple of thousand people. At three standard deviations above the mean the expected count is a handful, and at four it is likely zero. Scores in that region are produced by extrapolating a fitted curve beyond where anybody was actually observed. The extrapolation is reasonable but it is not measurement, and a score of 160 is a statement about the model rather than an observation about the person.
The second is that tests run out of items. A battery whose hardest item is solvable by most people at two standard deviations above the mean cannot distinguish between somebody at three and somebody at four, because both answer everything correctly. This is the ceiling effect, and it is why specialised high-range instruments exist and why ordinary batteries are explicit about their measurement range.
The third is that the true distribution is not exactly normal at the edges. Empirical work consistently finds slightly more people at the low extreme than a normal curve predicts, largely because pathological causes of low ability are not part of the same continuous process that generates ordinary variation. Whether there is a corresponding excess at the high end is disputed and harder to establish, precisely because the samples are too small to settle it.
The practical upshot is that scores between roughly 70 and 130 are well supported by data, scores from 130 to 145 are reasonable extrapolations, and anything above about 145 should be read as an estimate whose uncertainty exceeds the digits used to express it. Anybody quoting a score of 180 is quoting a model output, and usually a model that was never validated in that range at all.
8 The Standard Deviation Problem
One detail undermines more score comparisons than any other, and it is almost never mentioned when a number is quoted: not every test uses a standard deviation of 15. Checking the scale before comparing two numbers is basic hygiene, and how the leading online tests compare includes score range and precision among the criteria used to rank them.
The Wechsler scales use 15, which is the modern convention and the assumption behind the table in section 3. Older Stanford-Binet forms used 16. Cattell scales used 24. A number of high-range and society-administered tests use their own conventions.
The consequences are not small. A score of 132 on a scale with a standard deviation of 15 sits at the 98.4th percentile. The same numeric score on a scale with a standard deviation of 24 sits at the 90.9th. That is a difference between one person in sixty-three and one person in eleven, from the same two digits.
This is the mechanism behind a great many inflated historical figures. A score quoted from a test using a standard deviation of 16 or 24, then read by an audience assuming 15, converts into a rarity claim far more extreme than the original test ever supported. Most spectacular scores attributed to public figures dissolve on contact with this fact, which is covered in more detail in Highest IQ Ever.
The rule that follows is that a score without its standard deviation is not interpretable, and a percentile is the safer currency for comparison precisely because it does not depend on which convention the originating test used. If you have a percentile and a stated reference group, you have everything you need. If you have only a bare number, you have less than you think.
High IQ societies understood this long before the general public did, which is why their entry requirements are stated as percentiles rather than as scores. Admission at the 98th percentile is unambiguous and applies identically to any properly normed instrument. Admission at a score of 132 would mean one thing on a Wechsler scale and something considerably less demanding on a scale using a wider standard deviation, and the society would end up admitting two different populations under one rule. Defining the boundary in percentile terms removes the ambiguity entirely, and it is a useful demonstration that the people who deal with scores from many instruments at once long ago stopped quoting bare numbers.
9 Which Scale to Use When
Neither scale is better in general. They are suited to different jobs, and the reason reports print both is that neither alone is sufficient.
Use the standard score
For any arithmetic: averaging, computing differences between indices, comparing across testings, or reporting an effect size.
There is one more consideration specific to reports read by the person tested. Percentiles near the bottom of the distribution land harder than the equivalent standard score, because being told you are at the 5th percentile is a blunter statement than being told your score is 75. That is a real effect on how information is received, and it is one reason clinical reports are written with attention to framing rather than simply listing the most precise available numbers.
None of that justifies withholding a number or inflating it. It justifies presenting scores with their confidence intervals, with the reference group named, and with an explanation of what the measurement does and does not support, which is the difference between a report and a verdict.
10 Age Norms and Why Your Percentile Moves
One further source of confusion deserves its own section, because it produces apparent contradictions that look like test error and are not. The mechanism is the age norm, since an IQ test built on adult norms compares a result with people in the same age band, so the same raw performance can sit at different percentiles at 25 and at 65.
Adult IQ scores are normed within age bands. Your raw performance is compared against people in your own band rather than against all adults, which means the same raw score maps to different standard scores at different ages.
This matters because several abilities change systematically across adulthood. Processing speed and fluid reasoning decline gradually from early adulthood, while crystallised knowledge is stable or rises into later life. If norms were pooled across all ages, a sixty year old would be compared against the raw performance of twenty five year olds and would score lower on speeded and fluid measures for reasons of age alone.
Age norming removes that, and the removal is the point: the score answers how you compare to your peers, not how you compare to the fastest age group. But it produces a result that surprises people. Somebody whose raw performance declines slowly across two decades can hold a stable standard score throughout, because the comparison group is declining alongside them.
Both facts are true simultaneously and they are not in conflict. Raw performance changed. Relative standing did not. Which one is relevant depends entirely on the question being asked, and a report that does not say which one it is reporting is ambiguous in a way that matters. Long running cohort studies measure exactly that split, and the Lothian Birth Cohort retests hold rank order apart from raw performance across more than sixty years between the first administration and the second.
11 A Worked Example
Everything above becomes concrete on a single hypothetical profile. Suppose a report shows a full scale score of 118, a verbal comprehension index of 128, and a processing speed index of 102.
Start with the conversions. The full scale of 118 sits at roughly the 88th percentile. The verbal index of 128 sits at about the 97th. The speed index of 102 sits at about the 55th. Already the percentile version communicates something the raw numbers do not: 128 and 102 are twenty-six points apart, which sounds like a lot, but the percentile gap of forty-two points makes the practical distance clearer.
Now attach the intervals. If the full scale carries roughly plus or minus four points, the true value plausibly sits between 114 and 122, which is the 82nd to the 93rd percentile. The indices are shorter and less reliable, so their intervals are wider, perhaps plus or minus six. The verbal index is therefore somewhere between 122 and 134, and the speed index between 96 and 108.
This changes what can be said. The verbal-to-speed difference is large enough that even at the pessimistic end of one interval and the optimistic end of the other the gap survives, so it is a real difference rather than an artefact. That is the test a difference has to pass before it is worth discussing, and it is the reason intervals are printed rather than being a technicality.
Next, the base rate question from section 6 of Subtest Types. A twenty-six point gap between two indices sounds extraordinary. It is not especially rare: substantial index differences occur in a meaningful share of entirely typical people, because indices measure genuinely different abilities and there is no reason for them to move together. Statistically reliable and statistically unusual are separate tests, and this difference passes the first comfortably while being less exceptional on the second than it appears.
Now the mistakes to avoid. Averaging the two percentiles, 97 and 55, gives 76, which is not the full scale percentile and not anything else either. The correct route runs through the standard scores, and it produces 88 rather than 76. That twelve point discrepancy is the interval-scale problem from section 5 doing exactly what it does.
Finally, what the profile means. A person with strong crystallised ability and average processing speed is a common and coherent pattern, not a contradiction. It predicts that verbally demanding work will feel easier than work under time pressure, which is a useful thing to know and is invisible in the full scale figure alone. That is the entire argument for reporting indices separately rather than handing over one number: the single figure of 118 is accurate and tells you less than the three figures together.
12 How ACIS Reports Scores
ACIS reports on the standard convention, mean 100 and standard deviation 15, and presents percentile ranks alongside every index rather than only for the full scale figure.
Confidence intervals accompany the scores, for the reason in section 6: a single number implies a precision no test has, and omitting the interval is a presentation choice that makes a report look more authoritative than the measurement supports.
Norms are age banded as described in section 10, and the reference group is stated rather than left implicit, because a percentile without a named reference group is not an interpretable quantity.
The measurement range is bounded in line with section 7. ACIS does not report scores in ranges where the norming data cannot support them, which means it will not hand somebody a figure above the range its items can actually discriminate. That is a limitation, and stating it is more honest than producing an impressive number the instrument cannot justify. The provenance and construction of the norms are documented in the technical materials rather than asserted.
Domain scores are reported alongside the full scale figure rather than beneath it, for the reason the worked example demonstrates. A single composite is the most reliable number a battery produces and simultaneously the least informative about how somebody actually works, because it averages away exactly the pattern that makes one profile different from another with the same total. Presenting both is not redundancy, it is the minimum needed for a reader to see what their own number was assembled from.
13 FAQ: Scores and Percentiles
What percentile is an IQ of 130?
The 97.7th on a scale with a standard deviation of 15, meaning roughly one person in forty-four scores at or above it.
What percentile is an IQ of 100?
The 50th, by definition. A score of 100 is set to the mean of the reference sample, so half score above and half below.
What percentile is an IQ of 115?
The 84.1st, which is exactly one standard deviation above the mean. About one person in six scores at or above it.
Is percentile the same as percentage correct?
No, and they are unrelated. Percentile is your position among people. Percentage correct is the proportion of items you answered right. Someone at the 90th percentile may have answered far fewer than 90 percent correctly.
Can I average two percentiles?
No. Percentiles are not an interval scale, so their arithmetic mean is meaningless. Convert to standard scores, average those, then convert back.
Why do five points matter more at 100 than at 130?
Because the population is densest near the mean. Five points at 100 crosses about thirteen percent of people. The same five points at 130 crosses barely one.
Why does my score barely move the percentile at the top?
Percentiles compress at the extremes. The change is still large in rarity terms: 130 to 145 moves you from one in forty-four to one in seven hundred and forty-one.
How accurate is a single IQ score?
A well constructed full scale score typically carries a ninety-five percent confidence interval of about plus or minus four to five points, so 118 is properly read as a range from roughly 113 to 123.
My score changed by three points on retest. Did I improve?
Almost certainly not. A difference that small sits inside the measurement error of both testings and is noise rather than change.
Why do different tests give me different scores?
Different norm samples, different subtest composition, sometimes different standard deviations. A gap of several points between well constructed tests is expected.
What is a standard deviation of 16 or 24?
Older scaling conventions. A score of 132 sits at the 98.4th percentile on a scale with SD 15 but at the 90.9th on one with SD 24, from the same two digits.
Why is a score meaningless without its standard deviation?
Because the same number maps to different percentiles under different conventions. This is how many historically quoted extreme scores became inflated.
Are scores above 145 reliable?
They are extrapolations. Standardisation samples contain almost nobody that far out, so the figure comes from a fitted curve rather than from observation.
What does one in a million correspond to?
About 4.75 standard deviations above the mean on a scale with SD 15, which is roughly a score of 171. No ordinary battery can measure there.
Why does the distribution have more people at the low extreme than predicted?
Because pathological causes of low ability are not part of the continuous process generating ordinary variation, so they add cases the normal curve does not anticipate.
What is a ceiling effect?
When a test's hardest items are too easy to distinguish among high scorers. Everybody at the top answers everything correctly, so the test cannot separate them.
Are IQ tests normed by age?
Yes, in bands. Your performance is compared against people in your own age range, which is why the same raw score maps to different standard scores at different ages.
My raw performance declined but my score stayed the same. Why?
Because your comparison group changed with you. Raw performance fell, relative standing did not. Both are true and they answer different questions.
Which should a report show, score or percentile?
Both, plus the confidence interval and the reference group. Percentile communicates position, standard score supports calculation, and the interval states the uncertainty.
Is a percentile from an unnormed online test meaningful?
No. A percentile is always relative to a specific sample, and one computed against self-selected test takers rather than a representative sample overstates position substantially.
Should I use a cutoff score for a decision?
Not on a single point value. Somebody two points below a threshold may be above it in reality once the confidence interval is accounted for.
14 Best Next Step
The conversion between scores and percentiles is fixed and easy. What is not easy is remembering that percentiles compress at the extremes, that they cannot be averaged or subtracted, and that both scales carry an error term the printed digits conceal.
If you want the score scale itself explained in more depth, read IQ Percentile Chart. For what the middle of the distribution actually looks like, read Average IQ. To see index scores reported with their percentiles and confidence intervals attached, take the assessment.
The conversions in section 3 are properties of the normal distribution and can be verified with any statistical table. Claims about reporting practice and measurement error come from the professional standards and the methodological literature.
Crawford, J.R., Garthwaite, P.H. & Slick, D.J. (2009). On percentile norms in neuropsychology: proposed reporting standards. The Clinical Neuropsychologist, 23(7), 1173-1195. The methodological case for reporting percentile ranks with interval estimates rather than as point values.
Voncken, L., Albers, C.J. & Timmerman, M.E. (2019). Improving confidence intervals for normed test scores. Behavior Research Methods. Open access. How norm-sample size and model choice determine the uncertainty attached to a converted score.
Pearson (2008). WAIS-IV Technical and Interpretive Manual. Documents the mean 100, standard deviation 15 scaling convention and the reliability figures that determine confidence interval width.
Pearson (2008). WAIS-IV Score Report sample. Shows the reporting convention of index score, percentile rank, and confidence interval presented together.
Pearson (2024). WAIS-5, Wechsler Adult Intelligence Scale, Fifth Edition. The current adult battery and its reported score ranges.
American Psychological Association. Understanding psychological testing and assessment. Plain-language treatment of what a normed score expresses and why the reference group determines its meaning.
Educational Testing Service. Score scale and equating research. Why raw scores require conversion to a common scale before any comparison across forms or samples is defensible.
McGrew, K.S. (2009). CHC theory and the human cognitive abilities project. Intelligence, 37(1), 1-10. The ability structure that index scores are built to represent, and why composites carry more information than single measures.
Buros Center for Testing. Independent review body publishing the Mental Measurements Yearbook, which evaluates whether commercial tests report norms and error adequately.
Mensa International. What is IQ. Documents that admission is defined at a percentile rather than a score, precisely because scores from different instruments use different standard deviations.
National Center for Education Statistics. Understanding scale scores and percentile reporting in large-scale assessment. A worked example of why percentile ranks cannot be averaged or differenced.
Take the assessment
You get a profile, not a number
ACIS measures six CHC domains across 20 subtests and reports each one with its own normed score and confidence interval, so you can see where you are strong and where you are not.